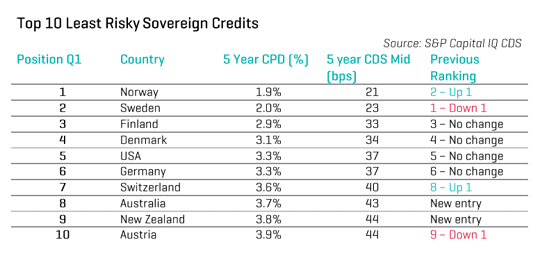
New Zealand, and Australia, have entered credit rating agency Standard & Poor's list of the world's top 10 least risky countries.
The list, included in S&P Capital IQ's latest quarterly Global Sovereign Debt Credit Risk Report, has New Zealand ninth, sandwiched between Australia and Austria. The report focuses on changes in the risk profile of sovereign debt issuers, with the intention of identifying key trends and drivers of change.
New Zealand and Australia are new entrants in the top 10 least risky list replacing Britain and the Netherlands.
In the chart below CPD stands for cumulative probability of default, which S&P says quantifies the probability of a country being unable to honour its debt obligations over a given time period. CDS stands for credit default swaps.

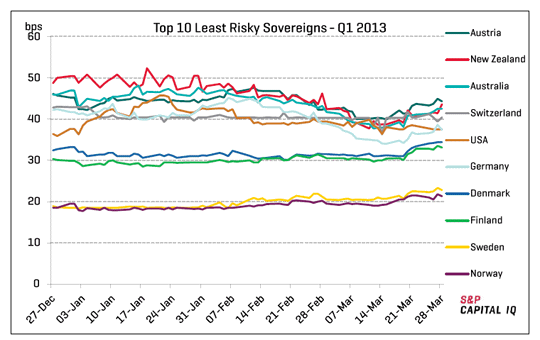
S&P also notes that CDS spreads in New Zealand came into line with Australia.


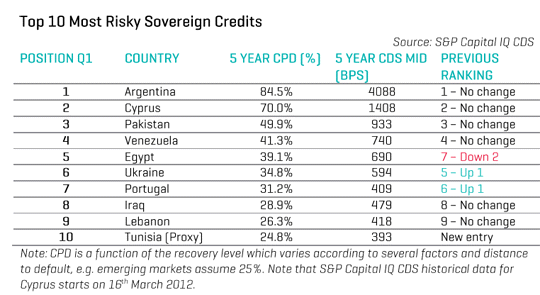
Meanwhile, Argentina ended the March quarter rated the riskiest sovereign credit with a one in two chance of defaulting before year's end. Cyprus was adjudged second most risky, with fellow European Union country, Portugal, coming in seventh.

S&P has an AA foreign currency credit rating on New Zealand with a stable outlook, and an AA+ domestic currency rating, also with a stable outlook. See more on New Zealand's sovereign credit ratings here and see credit ratings explained here.
5 Comments
I ran the numbers yesterday evening comparing S&Ps risk assessment with 10 government bond yields, as there should be a relationship.
-There is an extremely strong relationship between S&P risk assessment and 10 year bond yields, but with some interesting variations
-South American is consistently having higher bond yields than S&Ps risk assessment would indicate.
-Western Europe has lower bond yields than S&Ps risk assessement would indicate
-NZ, while bond yields are above average for S&Ps risk assessment, is not too far out from the middle of the pack.
-Why the #*^% does anyone invest in Qatar bonds (based on the page I got the 10year figures from, it is vastly under it's S&P risk position. Answer- If you want to put you money into government bonds in the Middle East, it is the only game in town).
It's like this:
“Reflecting our concerns around housing sector developments, the Reserve Bank has been developing a macro-prudential policy framework. We have recently consulted on this framework and will soon be signing a memorandum of understanding with the Minister of Finance to confirm the key elements of the policy, including governance arrangements,” Mr Wheeler said.
Deputy Governor Grant Spencer said that, while housing risks are growing, banks are performing well financially and have strong balance sheets. Their capital levels comfortably meet the new Basel III requirements that took effect in January.
“Looking forward, we want to ensure that bank capital requirements adequately reflect the risks around housing lending and accordingly we are undertaking a housing capital review. In the first stage of this review the Bank is increasing the risk weights applying to high LVR housing loans for the four major banks that use their own models as a basis for calculating minimum capital requirements.
“The increase in the risk weights, applying to all current and new high LVR loans for the major banks, will result in an average increase in capital held for housing of around 12 percent and will take effect from 30 September 2013. Read statement
Then this:
Overall, banks must hold "tier one" capital amounting to at least 6 per cent of their lending exposures. Tier one capital is the most enduring kind, mainly paid-up shares and retained profits.
For example, ASB's tier one capital as of December was $4.4 billion, including $3b in shares and $1.3b in retained profits. That amount was set against lending of $35.8b to produce a tier one capital ratio of 12.2 per cent – well above the regulatory minimum.
Unfortunately, it is more complicated than that because the lending figure is "risk-weighted". ASB's actual lending to customers was $55.5b and its total credit risk was $73.4b. But not all lending is seen as equally risky. Residential mortgages secured on property are not as risky as unsecured personal loans, so mortgages are discounted in the calculation, hence the lower figure used. Read article
We need to know what happens when the estimated $35.8bn level of credit risk becomes the actual $73.4bn amount owed. Where will the safety be coming from? - the citizens, the government?
Maybe LD50 really is the measure we need.
Following on from Chalkie...
Thing with mortgage brokers, they get paid by size, volume, scale. So each application they take "up to the makers name".
But commercially they are controlled by funder, who often pays legals, valuation, and offers $ for food or other indulgences (ipad therefore I am).
We remember the days when cardealer finance was recourse...
Imagine if brokers were recourse to funders..
they don't need to be as funders already own them. A sales channel more desperate for a loan than the borrower... no disrespect to desperate borrowers....
Excel spreadsheets while fun to use sometimes do have a lot to answer for..

We welcome your comments below. If you are not already registered, please register to comment.
Remember we welcome robust, respectful and insightful debate. We don't welcome abusive or defamatory comments and will de-register those repeatedly making such comments. Our current comment policy is here.