

Unless you’ve locked yourself away in a dark room for the past week, then you’ll have heard plenty of discussion about how bond markets have become increasingly gloomy about the economic outlook.
Specifically, yields on long-dated government bonds in the US have fallen below those of shorter-dated bonds – thus “inverting” the usually upward sloping yield curve.
So what should we make of this?
It’s important to note from the outset that there is no mechanical pass-through from an inverted yield curve to weakness in the real economy. Instead, the significance of the yield curve stems from the fact that it reflects the collective wisdom of deep and liquid bond markets. When long yields drop below short yields it’s because the markets are anticipating that central banks will need to loosen policy in the future to support a slowing economy.
The yield curve has inverted ahead of every recession in the US over the past 50 years, with only one false positive (in 1998). It’s therefore about as good a recession indicator as we’re going to get.
The big development over the past week or so is that yields on 10 year US government bonds have fallen below 3-month US Treasury bill rates. The more closely watched 10-2 year spread is still (just about) positive. But that doesn’t offer much reassurance since, at just 15bps, it is also now perilously close to inverting.
Admittedly, the yield curve may have been distorted by structural changes affecting the bond market in recent years. For example, regulatory changes have encouraged banks to hold more longer-dated government securities and central banks look set to maintain larger balance sheets than in the past. Both factors are likely to have pushed down longer-dated yields, thus making the curve more prone to inversion.
What’s more, irrespective of any structural changes in the bond market, the yield curve has never been a particularly good predictor of when a recession might occur. The 10-2 year yield has inverted anywhere between 9 and 23 months ahead of the past five recessions in the US. In other words, if the curve were to invert tomorrow, we might be looking at a US recession at any point between the end of this year and the middle of 2021.
But all of this risks missing the wood for the trees. Yes, the 10-2 year part of the yield curve hasn’t yet inverted and, yes, it’s true that the curve may be more prone to inversion now than in it has been in the past. But obsessing about whether or not the 10-2 year part of the curve will invert misses the bigger point that the whole curve has already flattened substantially – and that this has typically been a reliable indicator of cyclical economic downturns (if not recessions).
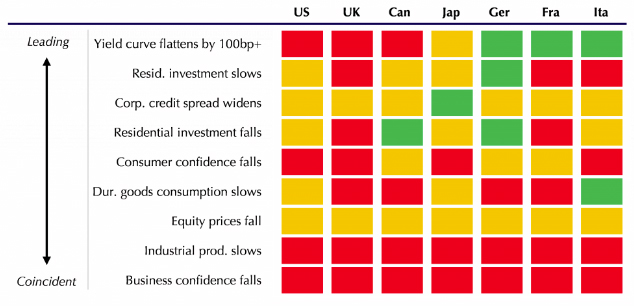
Moreover, while it’s true that the yield curve doesn’t have much to say about the timing of any future downturn, this feels like an odd argument to make when the economic data are deteriorating at an alarming pace. A few months ago I remarked that we had looked at the past 30 cyclical downturns in the G7 and identified key indicators that had signalled shifts in the cycle. What’s striking is just how many of these are now flashing amber or red, both in the US but also the rest of the developed world. (See Chart.) Against this backdrop, it would be a brave investor that downplays warning signs from the bond market.
Chart: Heat Map of Turning Points in Key Indicators around Cyclical Peaks (latest data)
Neil Shearing is the Group Chief Economist at Capital Economics, based in London. This article is re-posted with permission of the Capital Economics Australia & New Zealand Service. For more information or to request a trial contact alexander.klimov@capitaleconomics.com or call +61 2 9083 6809
3 Comments
38 years ago my economics lecturer introduced the use of a yield curve as a measure of where things are going
He was so far ahead of his time that most economics textbooks of the 1970's did not even mention it , but it was in use in the US .
He likened markets to shoals of fish that seemingly suddenly changed direction in unison , but pointed out that there was always a trigger to this phenomenon
A flattening yield curve is a sign the market is changing course , and has since toe 1970's been sign of a downturn
The bond market doesn't get as much attention here but other than derivatives the bond market is the biggest market in the world. When big shifts happen a lot of money can move quickly and sentiment in the market should not be taken lightly, where there are a lot of talking heads being dismissive of the inversion at this time.
We welcome your comments below. If you are not already registered, please register to comment.
Remember we welcome robust, respectful and insightful debate. We don't welcome abusive or defamatory comments and will de-register those repeatedly making such comments. Our current comment policy is here.