By Kymberly Martin
BNZ Interest Rate Strategy: Taking a 5-Year View
- 5-year interest rates are critical for borrowers, corporate issuers, mortgage holders and bond investors
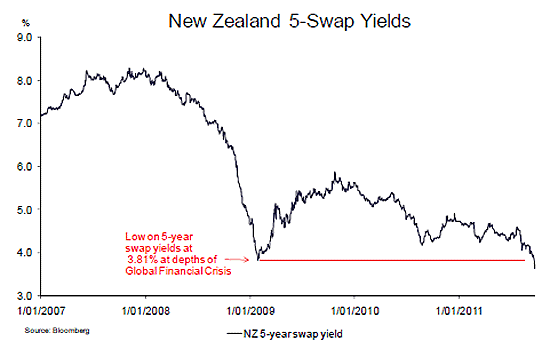
- 5-year swap yields currently trade below 2009 lows, capturing a fairly negative outlook for global and NZ growth and hence the NZ OCR
- They are consistent with the RBNZ on hold until the end of next year, and an eventual OCR peak at 4.0% in 2015
- A positively sloped yield curve reduces incentives for fixing medium-term interest rate risk…
- …however, 5-year swap rates at 3.64% suggest serious consideration should be given to hedging medium-term interest rate risk
There is significant uncertainty in the near term. It is hard to pinpoint the exact starting point of the OCR rate hiking cycle with precision. However, we have greater conviction that the market is underpricing the cyclical peak in the OCR in the medium term. This would suggest it is currently more compelling to fix interest risk over a 5-year time horizon than over a short-term horizon.
Why are 5-year yields important?
A lot of focus is given to the long-end of the NZ curve (10-year) and the short-end (3mth-2-year). However, for many fundamental reasons the 5-year is a vital part of the NZ interest rate curve.
First, for many businesses, five years is the maximum period over which they can borrow. This is partly determined by banks’ reluctance to lend for longer periods, due to unknown credit risk on a long time horizon. It also reflects companies’ unwillingness to take on debt beyond this time horizon, due to uncertainties in their own business forecasts.
Second, it is also an important part of the curve for corporate bond issuance. Five years provides corporate issuers with certainty of funding for a meaningful period, but is also a tenor that is attractive to investors. Within the NZ context, there is limited investor demand for 10-year corporate bonds. (The exceptions are investors with long duration liabilities).
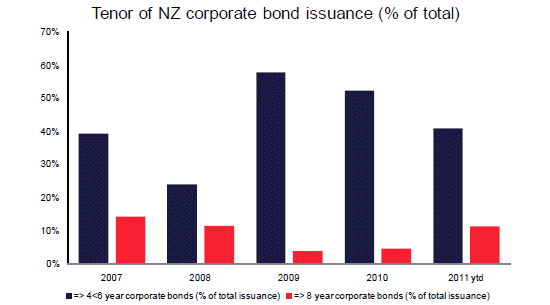
Over the past few years, bonds of a 4-6 year tenor have dominated corporate bond issuance. Bonds in this range have made up a quarter, to over a half, of all corporate issuance each of the past five years. Issuance in tenors
of 8-years+ has generally been only 5 to10% of total issuance (see chart).
Third, it is rare for NZ borrowers to fix mortgages for long periods of time. Fixed mortgages of more than 5 years generally make up less than 1%, of all fixed mortgages held by NZ banks. Fixing mortgages for 5 years is more common. Mortgages fixed for 4-5 years have been as high as 12% of all fixed mortgages held by banks, in the RBNZ dataset since 2004.
Finally, 5-year is an important part of the NZ Government bond curve. A third of all government bonds outstanding have a 4-6 year maturity.
What are 5-year swap yields telling us now?
NZ 5-year swap yields have been drifting lower on global growth concerns. The shift has been exacerbated by the 0.1%q/q release of Q2 GDP that disappointed markets expectations of 0.5%. 5-year swaps are currently yielding around 3.64%. This takes them below the January 2009 low of 3.81%. This implies the market is pricing a lower trajectory for the OCR over a 5-year time horizon, than it was at the gloomiest point in the Global Financial Crisis. The current 5-year rate and curve is consistent with a view by the market that:
- The RBNZ is on hold until late 2012 when it begins to raise rates with a 25bps hike in the OCR.
- The OCR then gradually inches up to around 3.25% by the end of 2013. i.e only 75bps of hikes over the next 2 years.
- The peak in the OCR cycle comes at 4.0% in 2015.
Where do we see 5-year yields relative to fair value?
The scenario implied by market pricing is some way below our own expectations. We expect the RBNZ to being gradually removing its stimulative monetary policy with a 25bps hike in H1 next year. We then expect the RBNZ to gradually raise rates to a peak of 4.75% in early 2013. The implied fair values for swap yields in this scenario are shown below. They are significantly higher than current market yields.
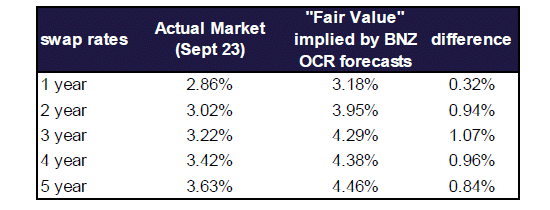
However, we acknowledge that near-term global uncertainty makes precisely timing the start of OCR hikes a fraught exercise. While the exact starting point may be hard to predict, we have greater conviction regarding the expected end point of the rate cycle.
We have greater confidence that the medium-term peak in the OCR will be closer to 5.0% than 4.0%. We continue to see lack of spare capacity in the economy, in terms of capital and labour. We see inflationary pressures in the economy continuing to build, as domestic growth shifts higher from a very low base over the coming 24 months. We also believe the RBNZ is likely to move gradually, to a peak over the coming 24 months, as opposed to the market’s implied peak in almost four years time.
Certainly, 5-year yields could still fall further. The market could move to price rate cuts from the RBNZ in the coming year. Declining US 5-year yields could continue to weigh on NZ yields. NZ 10-year bond yields that are now close to 2009 lows could make new historic lows. However, unless we construct an argument that NZ rates are moving into a completely different paradigm, where historic reference is no longer relevant (a discussion for another research note), current market pricing providesa large buffer, for even quite negative outcomes.
For example, we assume the RBNZ remains, on hold, at the historically low level of 2.50% for a whole further year, while it awaits global ructions to stabilise. It then begins its normalisation process, very slowly, inching up rates to a 4.75% peak, as late as the end of 2013. This scenario would still suggest that 3 to 5 year rates should be a lot higher. It suggests a 3-year fair value around 3.90% and 5-year around 4.2% i.e. 60-70bps higher than current.
There is significant uncertainty in the near term. It is hard to pinpoint the exact starting point of the OCR rate hiking cycle with precision. However, we have greater conviction that the market is underpricing the cyclical peak in the OCR in the medium term. This would suggest it is currently more compelling to fix interest risk over a 5-year time horizon than over a short-term horizon.
Hedging interest rate risk currently is counterintuitive
However, the decision to fix interest rate risk over a 4 to 5-year period, now, is not straight forward. It goes against intuition, and it provides a near term hit to cash-flow.
This is because the curve is positively sloped (although it has flattened meaningfully since April this year). For example, the new customer average floating mortgage rate is 6.1%% (as of July), the 2-year rate is 6.5% versus a 5-year rate of 7.7%. Given this profile, there are currently less than 1% of all mortgages fixed on a 4-5 year horizon. We believe similar trends are seen in business borrowing, assuming it is not constrained by corporate treasury policy guidelines.
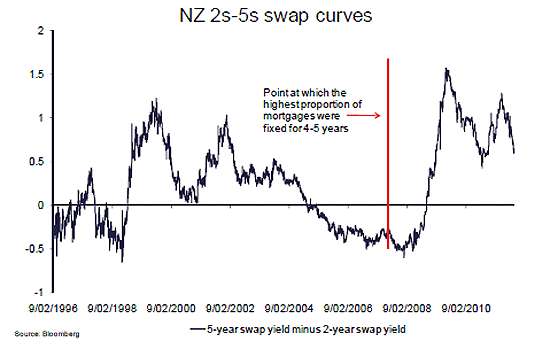
Ironically, the time when the highest proportion of bank-held mortgages was fixed for 4-5 years was around June 2007. At that point, the average new customer rate for 5-year fixed mortgages was 8.90%. No doubt, at the time, this decision to fix for a relatively long period was more intuitive. The curve was inverted, and the average new customer floating rate was 9.93%. The average mortgage floating rate in the intervening time (4 years and 2 months) has been around 7.80%. This average will fall further if rates were left floating for the entire 5 year period. Therefore, the decision to fix interest rate risk at 8.90% when the curve was inverted, in hindsight, was not optimal.
Conversely, at present, a decision to fix interest rate risk over a 5-year period could well prove to be optimal over the full period. It is difficult however, given the slope of the yield curve. It is also difficult, when short-term cash flow is a priority. A compromise could be to fix part of total interest rate exposure over a 4 to 5-year time horizon.
Where do we forecast 5-year rates going?
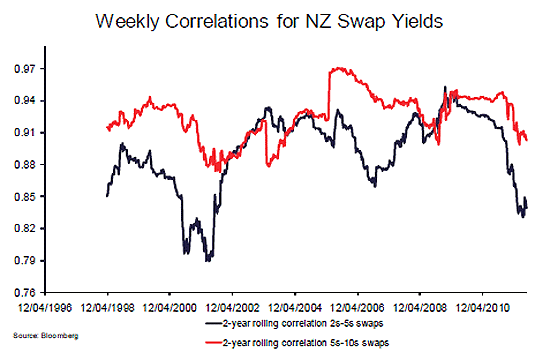
We forecast 5-year yields in relation to other points on the curve. The correlation between 5-year yields with 10-year yields is generally higher than between 2-year and 5-year yields.
Running a regression on the 5-year yield with respect to 2-year and 10-year yields returns a very close fit. i.e movements in the 5-year swap yield can be almost entirely explained by movements in 2 and 10-year yields. Movements are weighted more heavily toward 10-year rates.
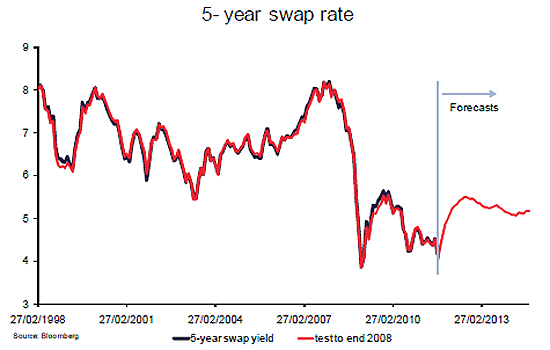
Our 2-year forecasts are derived from our view of the NZ OCR. Our 10-year forecasts stem from our view on the NZ and US yield curves. Using these forecasts as inputs, we forecast 5-year yields to rise to a peak of 5.50% in late 2012. This is consistent with our previous finding that swap rates historically peak some way ahead of peaks in the OCR.
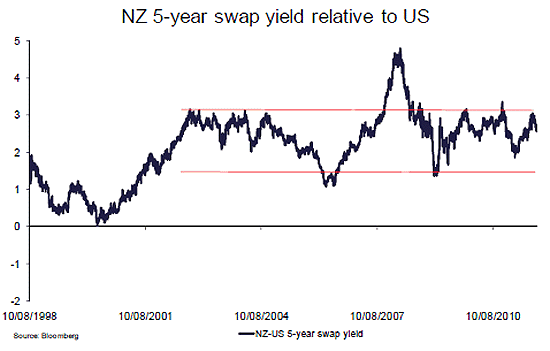
NZ 5-year swap yields have traded within a relatively stable 1.2% to 3.2% band relative to their US counterparts. A break-out occurred in late 2007 when NZ yields traded more than 4.7% higher. They currently trade some way above the middle of their range. Our forecasts see NZ 5-year yields trading to the top of this band over the coming year, as US mid-curve rates remain anchored by a Fed ‘on hold’ until mid 2013.
Risks to our view
The key downside risk to our view come from the potential for the European debt crisis, to descend into global financial markets disintegration. The most obvious catalyst would be a disorderly Greek default. In response, the RBNZ is one of the few key central banks globally, in the enviable position of being able to cut i.e its current OCR is some way above zero. In this case, there could
still be further downside to NZ 5-year rates.
A second downside risk is that markets may further discount a low growth environment in the US, putting continuing downward pressure on US 5-year yields. This could drag NZ yields lower, below historic norms, as global investors continue to scour the globe for relatively “safe” yield.
Upside risks to our view exist, in a scenario where current global ructions, whilst disruptive, prove to have limited effect on the real NZ economy. In that case, the RBNZ could be forced to hike more rapidly than we forecast. This risk is particularly acute if dampened risk appetite sees the NZD trading in a lower range. In this case the strong NZD would no longer be doing much of the ‘work’ in tightening monetary conditions for the RBNZ.
No chart with that title exists.
Kimberly Martin is part of the BNZ research team.
2 Comments
Yep, count me in - I want to fix my mortgage at 7.7% right now.
Because my Floating at 5.7% is just not satisfying. Plus I want to pay my bank another $10,000 'break fee' when I move house. Plus I don't want to have the option of changing banks without the break fee.
Where do I sign up? Please charge me more. In fact why not 13% or 19% - in line with the bank credit card rate (which has not come down in line with OCR drops).
A interesting article that raises some obvious questions. It states that in June 07 the average 5 year rate for new mortgages was 8.9%. If you choose the 5 year tab and move the two sliders on the Westpac chart to the extreme left you will see the swap rate in June 07 was 7.8% peaking at 8.18% and finishing above 7.9%. That means the 5year mortgage rate was around 1% above the 5 year swap rate. Fair enough. Now move the sliders to the extreme right and look at September 2011 and you will see a 5 year swap rate of 4.19% dropping to 3.69% (or look at the table in the article which gives 3.63%). The BNZ now offers a 5 year mortgage of 7.75% which is 3.5 to 4.1% above the 5 year swap rate. Why? Why did we pay 1% more than the swap rate in 2007 but a 4% premium in 2011?


We welcome your comments below. If you are not already registered, please register to comment.
Remember we welcome robust, respectful and insightful debate. We don't welcome abusive or defamatory comments and will de-register those repeatedly making such comments. Our current comment policy is here.