
This article was originally published by The Treasury as a Special Topic in the September edition of their Monthly Economic Indicators.
- - -
How banks set mortgage rates relative to the Official Cash Rate (OCR) is important for how monetary policy affects the economy.
This month’s special topic focuses on how the relationship between wholesale rates and their corresponding mortgage rates has changed, the possible reasons for these changes and whether they are likely to be permanent.
The topic concludes that the increase in the spread between wholesale and retail interest rates since the GFC is largely a result of changes in funding costs for banks arising from market and regulatory changes. With the regulatory change being permanent, the increase in spreads is likely to remain. This suggests that for a given retail rate the neutral 90-day rate is lower than prior to the GFC.
Mortgage spreads have risen significantly following the global financial crisis...
In the four years before the global financial crisis (GFC), the spreads between the new customer floating mortgage rate and the 90 day rate, and between fixed mortgage rates and their corresponding swap rates averaged around 180 basis points (bps) and 90 bps respectively (Figure 7). However, following the GFC these spreads all increased significantly – by 100-150 bps depending on the time to maturity, although the spreads for fixed mortgage rates have declined by 50-100 bps since 2012.

...but was this just a result of less competition in the banking sector?
To see whether the increase in spreads was owing to reduced competition in the banking sector since the GFC, the pre-GFC and post-GFC retail bank margins were compared. Before mid- 2008 they averaged 230 bps and since 2011 they have also averaged 230 bps, suggesting that the increase in spreads between mortgage and wholesale interest rates does not reflect a change in bank competition from the earlier period. In addition, the structure of the banking industry has not changed significantly over this period.
New liquidity regulations were introduced following the GFC...
In order to see why the spreads between wholesale and retail interest rates have increased since before the GFC, it is necessary to look at changes made as a result of the GFC. During the GFC it became apparent that banks were unable to access liquidity in global financial markets as a result of the crisis. When confidence diminished, some bank customers wanted to access their deposits, but some banks were unable to provide these funds and so required their government to provide temporary relief. In view of those developments, the RBNZ introduced the Basel 3 Liquidity Policy (BS3) to improve liquidity in the NZ banking system and provide a buffer in times of crisis.
The regulation requires NZ banks to hold a minimum core funding ratio (CFR). The CFR is a comparison between an estimate of the bank funds that are stable and can be assumed to stay in place for at least one year (core funding) and the core lending business of the bank that needs to be funded on a continuing basis.
The RBNZ adopted this regulation in March 2010 with a CFR of 65% to be achieved by April 2010 and subsequently increasing to 70% by July 2011 and 75% by January 2013.
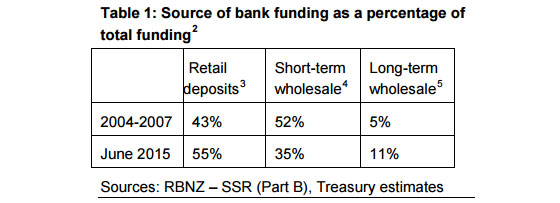
This new policy led banks to change the sources of their funding. The BS3 regulation deems retail and long-term wholesale funding more likely to stay in place, and so qualifies as part of core funding; consequently these sources of funding increased as a percentage of total bank funding to meet BS3 (Table 1). 6 As a result of the BS3 regulation, banks became indifferent between retail funding and long-term wholesale funding, so if the cost of long-term wholesale funding rises (internationally set), banks will increase their deposit rates until they reach the point of indifference.
...which contributed to increased bank funding costs
Following the collapse of Lehmann Brothers in October 2008, banks’ cost of funds increased significantly. As that cost cannot be observed directly, the marginal cost of funding7 was adopted as a proxy in this study. The increase in the marginal funding cost can be traced to the significant rise in short-term8 and long-term9 wholesale funding costs, as banks experienced difficulty accessing funding markets (Figure 8).

Following these developments, as banks knew the liquidity regulations were about to be implemented and long-term wholesale funding costs were exceptionally high, they funded most new credit from retail deposits. As a result, competition for retail funding10 increased and its cost rose significantly. In February 2009 the six month deposit rate rose above the OCR for the first time since 2005.
In the post-GFC period, long-term wholesale funding costs declined owing to increased liquidity provided by central banks in global financial markets, increased risk appetite, and higher issuance of NZD bonds by offshore entities (which reduced hedging costs). These factors, along with stronger household deposit growth relative to growth in residential mortgage loans, lowered bank competition for deposits, reducing the retail funding premium. Since the end of 2014, household deposit growth has exceeded residential mortgage loan growth, leading to the retail funding premium declining further (Figure 8).
Marginal funding costs do not account for the entire increase in new customer mortgage rates
The increase in the marginal cost of funding is able to explain some of the difference in mortgage spreads before and after the GFC. However, as the mortgage spreads including the marginal cost of funding are still circa 100 bps higher than before the GFC, they are not sufficient to explain the entire change (Figure 9).

The fact that the marginal cost of funding does not explain the increase in spreads since before the GFC is partly because of a limitation of the data. The new customer mortgage rate series shows only the advertised rates and does not include special or discounted rates offered to borrowers. These special rates offered since mid-2014 would lower the fixed mortgage rate series, decreasing the spread from the corresponding wholesale rate. Data in the RBNZ’s May 2015 Financial Stability Report showed that 2-year fixed mortgage rates including specials11 have ranged from about 20 bps lower than the equivalent standard mortgage rate series in May 2014 to 60 bps lower than the equivalent mortgage rate series in March 2015.
Average funding costs can explain the difference though
To overcome the limitations of the data for new customer mortgage rates, a comparison between the effective mortgage rate12 and the average funding cost13 banks face (as opposed to the marginal funding cost) shows the relationship between bank funding and mortgage rates. In the pre-GFC period there are two distinct phases – 2002-2004 and 2006-2008. In the transitional period (2004-2006), the Reserve Bank tightened monetary policy so both short-term wholesale rates and deposit rates increased significantly, but – as many mortgage rates were fixed – the spread between mortgage rates and wholesale rates declined by around 180 bps (Figure 10).

The spread then peaked in early 2009, as bank funding was very expensive, despite the OCR being at an all-time low of 2.50%. Since the middle of 2011, the spread has remained between 300 and 350 bps as mortgage rates have largely moved in line with average funding costs.
What does all this mean?
The increase in bank funding costs, owing to the CFR and changes in market pricing of risk, led to higher mortgage rate spreads and so borrowers faced higher mortgage rates.
The CFR effectively requires the full cost of risk to be priced into bank funding costs, which banks have transferred to their customers.
The CFR is permanent, indicating that the increase in mortgage spreads is a permanent shift higher (provided market pricing of risk remains unchanged) and bank competition is unlikely to erode it in the future.
The result is that the spread between mortgage rates and the OCR is higher, suggesting that for a given retail rate the neutral 90-day interest rate is lower now than it was prior to the GFC.14
Funding costs in the future
While funding costs have been relatively stable since 2012, there are risks that they will increase. Some of these risks are:
• An international event that pushes up longterm rates. This would result in higher wholesale funding costs for banks. In turn, competition for retail deposits would rise and banks would increase retail deposit rates until the indifference point. Bank funding costs would then increase as a result of higher rates from both these sources of funding, increasing mortgage rates for a given OCR.
• The issuer credit rating of NZ banks is downgraded. While the standalone credit rating of NZ banks has recently been downgraded by Standard & Poor’s owing to their exposure to the Auckland housing market, the issuer credit ratings of the big four banks in NZ (higher credit-rated parent companies), Kiwibank (subsidiary of NZ Post), and Rabobank New Zealand (the local unit of Dutch bank Rabogroup), remained unchanged. If the credit ratings of Australian banks were downgraded (parents of the big four banks in NZ), this would likely result in long-term wholesale funding costs of the big four banks in NZ rising. The overall result would be the same as above – higher funding costs through long-term wholesale and retail rates, resulting in higher mortgage rates for a given OCR.
• A sharp increase in credit growth creating additional demand for deposits locally. If the supply of local deposits did not increase to match the additional demand, banks would source more of their funding from offshore wholesale markets. International borrowing rates would be unlikely to rise (as NZ banks’ demand would be marginal), unless a risk premium was associated with the increase in credit growth. In that case, domestic deposit rates would be likely to rise to match the offshore funding rate faced by the banks. This scenario is more likely to play out with longerterm borrowing as banks would be more likely to seek increased deposits for floating mortgages rather than long-term wholesale funding.
1. [relates to an earleir article in the MEI report.]
2. Total funding is estimated as the sum of NZD and foreign currency funding. Note that due to rounding totals may not sum to 100%
3. NZD retail funding
4. Wholesale funding with a maturity rate of less than one year
5. Wholesale funding with a maturity rate of at least one year
6. The sum of long-term wholesale and retail funding percentages are less than the CFR (86.9% as at June 2015). This is because the CFR also includes half of any tradable debt securities issued by a bank with the original issue of two years or more and with residual maturity of more than six months, and tier one capital. Note that total loans and advances – the denominator – is also less than total funding.
7. The marginal funding cost is the premium the bank faces over the current 90-day rate for funding one extra dollar. It is calculated as the weighted average (by funding ratio) of short-term wholesale funding, longterm wholesale funding, and retail funding.
8. Short-term wholesale funding is proxied as the LIBOR less the OIS rate.
9. Long-term wholesale funding is proxied as the spread between US AA-rated financial bonds (as NZ banks were AA-rated until mid August 2015) and the US 5- year swap rate. In addition, the NZD/USD basis swap (cost of currency hedging) has been used to proxy the premium of long-term wholesale funding costs.
10. Retail funding cost is proxied as the six month deposit rate less the 90-day rate.
11. Data series is only available back to 2008 so comparisons before the GFC are not available. This series is a simple average of the four largest banks and not related to the amount of mortgage lending at that specific mortgage rate.
12. Effective mortgage rate is a weighted average of interest rates currently being paid across all types of mortgage lending.
13. Average funding cost is calculated as the weighted average of long-term wholesale, short-term wholesale and retail funding costs as opposed to the premium. Note long-term wholesale costs were not included over the December quarter of 2008 as banks were unable to borrow on the bond market.
14. For more discussion on neutral interest rates see: Richardson, A. & Williams, R., (2015) ‘Estimating New Zealand’s neutral interest rate’, Reserve Bank of New Zealand Analytical Notes Series AN2015/05, Wellington
This article was originally published by The Treasury as a Special Topic in the September edition of their Monthly Economic Indicators.
6 Comments
Funny how you are supposed to be so knowledgeable but constantly whine about such a known issue and offer no alternatives.
Or is it I wonder because nowhere is safe to hide your wealth so look for the poorer ppl ie tax payers to protect your gains for free.
Simple, dont invest your money in a deposit account, be brave go out in the world and invest in the market you helped bring to this state.
As always, I remain fully engaged. Acting as an advocate for others not so blessed is not a crime.
Agree Stephen certainly seems to have a sermonizing opinion about every minuscule topic (I equally lecture but about only one topic really!). Sometimes I read his links, sometimes I wonder H.T.F. could anyone have so much time to post so much and have such strong opinions! But good on Stephen for his contribution.
stephen i'm not clear what your background is? you are obviously informed on happenings. I am vaguely aware of your OMO website
Could someone please explain why retail funding cost can be proxied as the six month deposit rate less the 90-day rate.
Where would I find the six month deposit rate and the 90-day rate? Is there a rate which has already consolidated these two rates?
I presume retail funding cost means how much the bank is paying for the money they are lending to me. I really want to know what is the Bank's mark up to my mortgage rate (to help me haggle).
Any assistance appreciated.
Cheers,
I give up - this is worse than Fonterra's Annual Financial Accounts using 4 different types of accounting rules (standards) which Keith Woodford tried to unpick
2. Total funding is estimated as
3. NZD retail funding is
4. Wholesale funding > 1 yr is
5. Wholesale funding
We welcome your comments below. If you are not already registered, please register to comment.
Remember we welcome robust, respectful and insightful debate. We don't welcome abusive or defamatory comments and will de-register those repeatedly making such comments. Our current comment policy is here.