

In the May Monetary Policy Statement the Reserve Bank stated that "Movements in domestic long-term interest rates are mainly driven by movements in global rates". This is probably a quite widely held view but that doesn't stop it from being wrong.
Global developments are relevant to NZ long-term interest rates and will be most important if there is another crisis. But in general local factors are more important to NZ long-term interest rates, as is shown in this Raving.
Why is this important? If you are a local borrower it is hugely important whether local or global factors dominate local long-term interest rate behaviour. This is partly because NZ isn't a crisis country while most major countries are in terms of debt levels, while NZ growth isn't as linked to global growth as suggested by the Reserve Bank. The link between NZ and global growth will most likely be the topic of the next Raving.
It has huge implications for how much NZ interest rates are likely to increase in response to Reserve Bank and government pro-growth and pro-inflation policies that the last Raving touched on.
It is highly relevant in the context of the topic of the last Raving: the case for locking in some longer term fixed interest rates.
At face value global factors dominate NZ long-term interest rate behaviour, but …
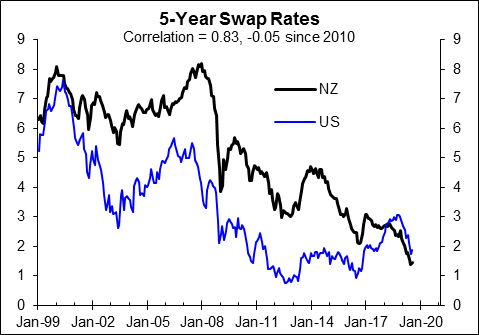
The RB's claim that "Movements in domestic long-term interest rates are mainly driven by movements in global rates" seems to get good support from the chart below that shows a quite high correlation of 0.83 - 1.0 being the maximum possible - between the NZ and US 5-year swap rates since 1999. US longer-term interest rates are justifiably used as a benchmark for global long-term rates. But the chart should ring a note of caution about the RB's claim because since 2010 the correlation is -0.05.
To the purest "movements" in interest rates relate to changes over some period of time, not levels. In light of that, the chart below compares annual percentage point changes in the NZ and US 5-year swap rates. This time around the correlation is much more stable over time, being 0.63 over the full period, 0.62 prior to 2010 and 0.71 since.
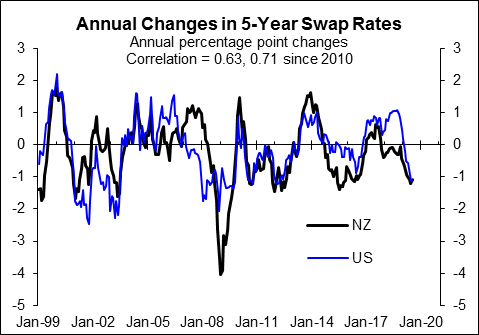
However, for the real purest monthly percentage point changes would be more enlightening and for them the correlation drops to 0.53 over the full period and to 0.48 since 2010.
This analysis provides some but not overwhelming support for the RB's claim. However, fuller analysis provides more reason for doubt.
The RB's claim is shaky based on the link between NZ short and long-term rates
The RB's claim that global interest rates mainly drive NZ long-term interest rates seems to be pretty widely held. But as can be the case with consensus views that get repeated without being checked, this claim doesn't stand up to even basic analysis.
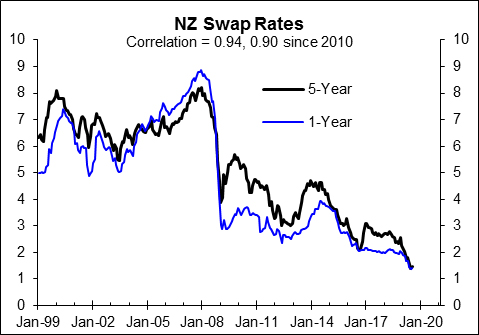
If global factors mainly drive NZ long-term interest rates there should be a higher correlation between NZ and US long-term rates, with US rates used as a proxy for global rates, than between NZ long-term and short-term rates. But the opposite is the case. The correlation since 1999 and much more since 2010 is higher between NZ long-term and short-term rates (chart below) than between NZ and US long-term rates (adjacent chart).
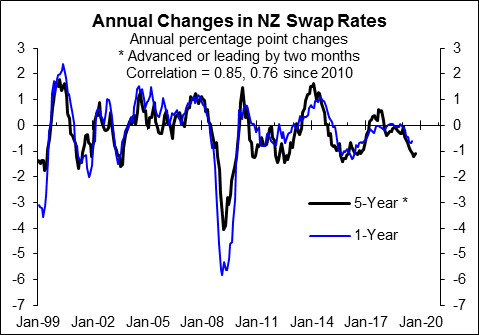
It is a similar story for annual percentage point changes. The chart below shows the correlations are higher between NZ long-term and short-term swap rates than between NZ and US longer-term rates in the adjacent chart. For monthly percentage point changes the NZ correlations are 0.74 for the full period and 0.65 since 2010; again higher than for NZ versus US longer term rates.
Maybe the RB's claim is based on superior analysis that uses sophisticated mathematical techniques to assess the relationship relative to the reasonably simple but intuitive analysis used on the previous page. But I doubt it. I suspect it is another case of conventional wisdom being rolled out with no real attempt to check whether it is right; which is much easier to do than do even simple analysis.
The analysis suggests expectations about the OCR are more important to NZ long-term interest rates than global long-term interest rates. Interestingly, this fits with the finance theory that was behind the analysis of international interest rate behaviour I did at the Bank of England, as discussed in the context of the case for fixing long-term in the last Raving (see http://www.sra.nz/pdf/FixingDebtJul19.pdf).
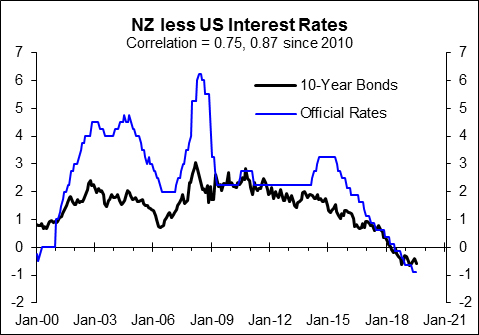
Another way of viewing this issue is to look at how the gap between NZ and US long-term interest rates behaves relative to the gap between NZ and US official interest rates (next chart). The two gaps don't move proportionately but when the OCR increases or falls relative to the Fed Funds Rate so does the NZ 10-year bond yield relative to the US 10-year bond yield. Bond yields are used in this case to show that it is a general pattern of behaviour across swap and bond markets.
If the OCR ends up increasing considerably relative to the Fed Funds Rate in response to NZ's pro-growth, pro-inflation policies being more misguided than Trump's policies and higher debt levels being more of a constraint on how much US interest rates can increase, NZ longer term interest rates will increase lots relative to US long-term interest rates. What happens to US/global long-term interest rates will still be relevant but won't be the main driver of NZ long-term rates; contrary to the RB's claim.
The RB is right in suggesting short-term local rates are largely linked to the OCR
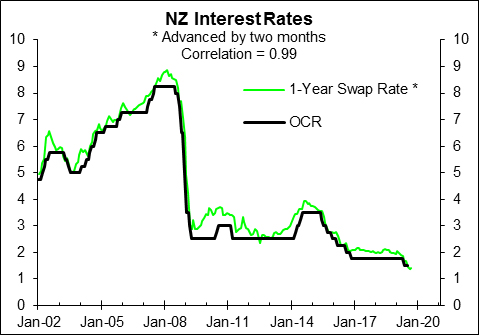
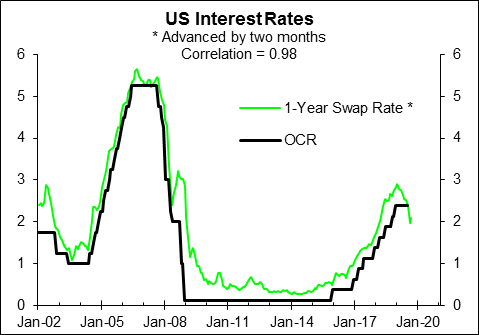
The RB is right in suggesting that "short-term rates are more influenced by expected monetary policy." The next chart shows a 0.99 correlation between the NZ 1-year swap rate and the OCR and the second chart shows a 0.98 correlation for the Fed Funds Rate and the US 1-year swap rate. In both countries peak correlations are with the swap rates leading by two months. This is because the market responds quicker to new info than the RB and Fed; at times the market has reacted much more than two months before OCR hikes in NZ.
The market's expectation about the very near-term outlook for the OCR largely drives NZ short-term wholesale interest rates. The market's expectation about the longer term outlook for the OCR, that is pretty myopic, is of most importance in driving NZ long-term interest rates; more so than US/global interest rates, except in the instance of a crisis.
Interestingly, the US 10 year bond yield effectively behaves like a global rather than US-driven interest rate. As will be featured in the July edition of the Economic Roadmap report that covers prospects for NZ and NZ's major trading partners, there is a much stronger link between the US 10-year bond yield and leading indicators of global growth than there is between it and US leading indicators. This makes it a truly global benchmark interest rate.
This article is re-posted here with permission. The original is here. Rodney Dickens also says: " In light of the importance of this issue that is covered in detail in the latest Economic Roadmap report I am offering the latest report to business and other major borrowers on a complimentary basis."
6 Comments
Are you talking about unfunded interest rate swap rates? Moreover, the latest 5yr IR swap quote at 1.86% is inexplicably lower than the 5yr UST yield at 1.868%. The veracity of using this derivative as a benchmark interest rate is surely called into question when it fails to correctly register the credit risk of the participating conterparties to the trade.
Maybe the RB's claim is based on superior analysis that uses sophisticated mathematical techniques to assess the relationship relative to the reasonably simple but intuitive analysis used on the previous page. But I doubt it.
Yep. Let's just say a slightly superior level of analysis, Rodney.
https://www.rbnz.govt.nz/-/media/ReserveBank/Files/Publications/Analyti…
Hmmmm .... "Term Premiums"?
Central Bankers Follow Bonds, Then Insist They Aren’t And That Bonds Agree With Them
Unfortunately, whilst in general I concur, NZ is in fact a country with v high levels of debt: PERSONAL debt.
Particularly mortgage debt loaded on a v small % of the population and a small % of those who are not renting, both in numeric terms and in which age brackets are most affected by most debt. This has particularly been so in Auckland in the last 5 years and no one wants to put up stats on it because the stats are aggregates, like so many other useless and misleading averages.
By the by, slightly off point, interest rates lower now than 2 years ago nest pas? Commentators think this means better for buyers. Buyers down 30% in Auckland compared to 2 years ago. And 2017 was NOT a good year.
Demand is not equal, therefore, to numbers but to real people not wanting to buy for various reasons. Plainly, interest rates is not the primary one.
We welcome your comments below. If you are not already registered, please register to comment.
Remember we welcome robust, respectful and insightful debate. We don't welcome abusive or defamatory comments and will de-register those repeatedly making such comments. Our current comment policy is here.