By Sandeep Parekh*
Yield curve inversion, where long-term interest rates are lower than short-term ones, is often touted as a possible precursor to economic recession.
That’s because an expectation of economic growth is typically reflected in investors demanding a higher yield to offset the risk of the inflation which typically accompanies growth.
However, how much this indicator should be trusted is hotly debated. It has got a great track record but there have been lots of weird things going on in interest rates and monetary policy this decade that may have invalidated it.
In New Zealand meanwhile, the yield curve’s track record isn’t so good at predicting a recession, so ANZ Research isn’t reading too much into the inversion that has also been seen here. But clearly there are expectations of interest rates being lower for longer.
This will stimulate the economy. But as interest rates get ever lower, the offsets get stronger, including the negative impact on savers and bank margins, impacting credit availability. ANZ Research expects it will take a couple more cuts before the Reserve Bank of New Zealand (RBNZ) is comfortable with the medium-term inflation outlook.
The US is not New Zealand’s most important trading partner but it is the world’s largest economy and has an enormous impact on those we do trade more significantly with - most notably China. It is therefore worth keeping a close eye on goings-on in the US economy.
Impending recession?
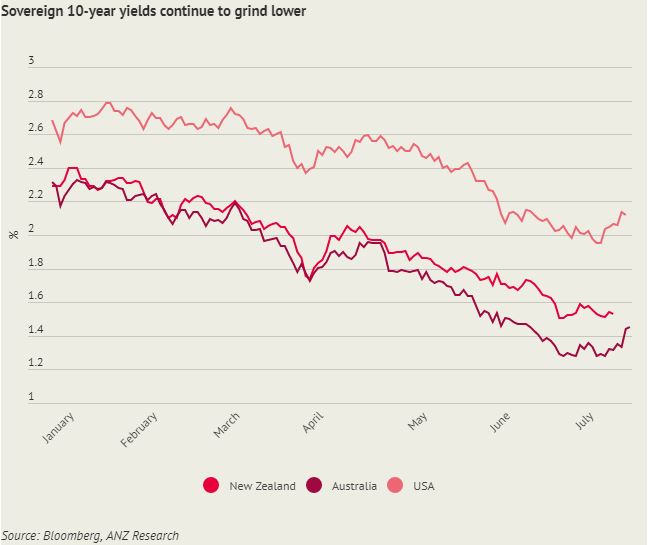
The shift towards an easing bias by the US Federal Reserve in June sparked a global hunt for yield, which saw US 10-year Treasury yields plummet below 2.0% for the first time since 2016.
Yields on longer-dated bonds (such as the 30-year US Treasury note) also capitulated, dragging peer curves lower as a result. Those jurisdictions that saw their yields trade on the cusp of negative rates prior to this meeting (such as Germany and Japan) saw 10-year yields fall below zero, setting new lows along the way. New Zealand and Australia were not immune to these global moves and also set fresh lows along the way.
The Federal Reserve’s clear shift towards easing monetary policy has also given rise to further inversion of the US yield curve. The difference between the 10-year and 3-month interest rates has persistently flirted with zero since March this year, leaving many wondering if this could be a precursor to an impending recession.
Indeed, the Federal Reserve assesses the probability of a recession using this interest rate differential, publishing their findings on a monthly basis. As at 30 June, it was implying a 33% chance of a recession in the US in the coming 12 months. This is eerily close to the 35% chance the curve implied in the lead-up to the global financial crisis (GFC). So how worried should we be?
The US yield curve is certainly telling us something and, while ANZ Research is not expecting a US recession, forecasts are for Fed rate cuts over the rest of this year. Risks to the global economy are certainly heightened at present but ANZ Research thinks the markets’ expectations for US rate cuts are more about the weak inflation outlook than a widespread expectation a recession is imminent.
That said, plenty of people argued adding additional fiscal stimulus to an already hot US economy last year would end in tears in 2020. And yield curve inversion does tend to be quite agnostic about timing. So ANZ Research certainly are not ruling out the possibility the yield curve could have the last laugh.
Common in NZ
So what about the New Zealand experience? The local yield curve has spent time in inverted territory recently too. Should Kiwis be worried?
Probably not.
Firstly, New Zealand 10-year yields are highly correlated to global 10-year yields, meaning changes to the global economic picture can drive them as much as the local data does. Of course, changes to the New Zealand economic outlook (including inflation expectations and perceived risk, not just the growth outlook) also play a part in how the New Zealand 10-year yield trades.
Typically, in times of rising global uncertainty, NZ 10-year yields will move lower to reflect global headwinds. However, as a small open economy, these global headwinds impact New Zealand too, so a lower 10-year yield isn’t inappropriate.
What about the short-term part of the equation? The standard reference 3-month interest rate in New Zealand is set in the Bank Bill market. This market has in recent years become increasingly illiquid, with the 30-day rolling turnover averaging approximately $NZ100 million. This makes it more volatile.
This rate is also relatively less sensitive to changes to interest rate expectations (as opposed to the 3-month OIS rate for example) and has in some instances even lagged a cut to the OCR. It therefore isn’t going to be a perfect measure of near-term interest rate expectations.
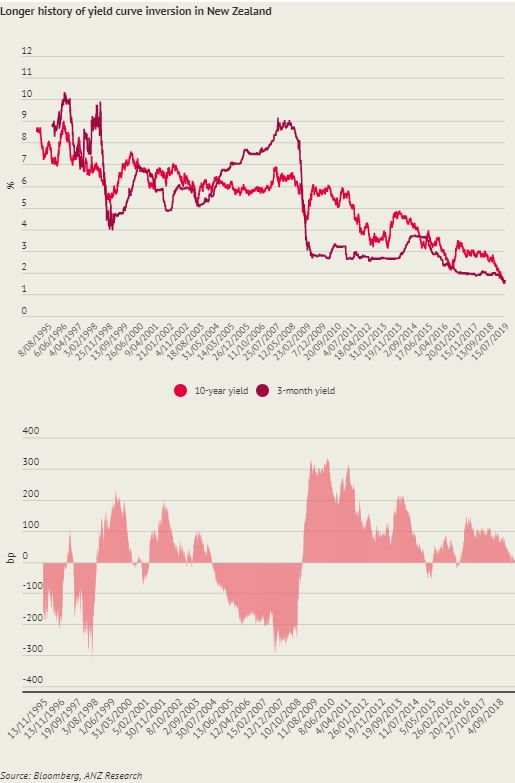
Looking further back, it is clear yield curve inversion is far more common in New Zealand than has been the case in the US. The New Zealand yield curve has been heavily inverted numerous times in the past few decades, without an imminent recession. For example, the New Zealand yield curve was persistently deeply inverted from 2004, long before the GFC put New Zealand in a recession.
Looking ahead, ANZ Research thinks it’s likely the recent yield curve inversion will prove a false signal for the New Zealand economy. Yes, domestic growth has been slowing for some time and headwinds are evident but tailwinds are also present and preventing the economy from slowing too abruptly.
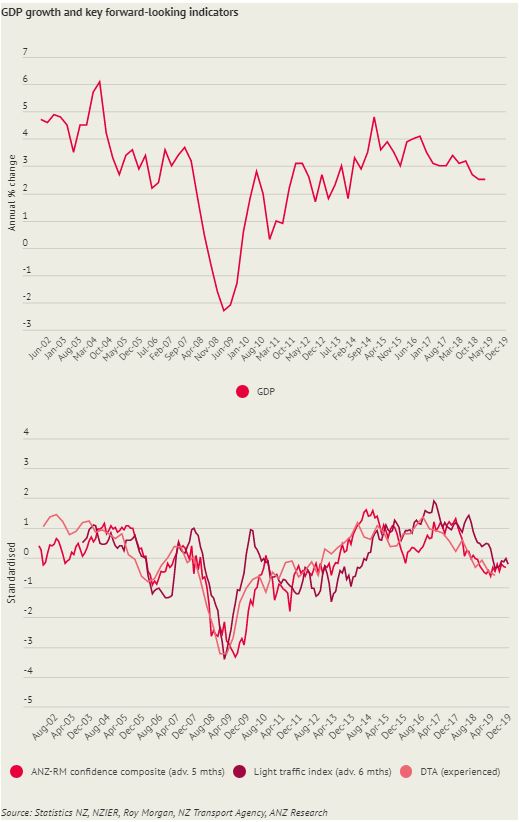
Indeed, ANZ Research expects the recent slowdown in growth to find a floor about now, before gradually accelerating from the second half of the year. And, on balance, key forward-looking indicators corroborate this view.
That said, global risks are probably the biggest threat to the New Zealand economy - so whether the US yield curve is right in predicting a recession still matters.
*Sandeep Parekh is foreign exchange/rates strategist at ANZ. This article was first published on ANZ's Blue Notes website and is used here with permission.
6 Comments
All these numbers and opinions. Everyone economist has a different view. Mine is simpler. Our wealth is based on cheap and abundant oil and the ignoring of the consequence of it's use. That's coming to an end (one way or the other). The only question is to what degree we will feel it. Pretending you know the answer to this is arrogance.
A simpler explanation is that our 10 year bonds are being bought due to capital flight from Asia and Europe.
There are trillions of government bonds there that yield less than 0%. This indicates lack of opportunity for capital in those countries. This is the consequence of excess productive capacity in those countries for things we don't need. This in turn has been fueled by rampant attempts at currency devaluation in those countries, which we have been forced to match to a less extreme degree.
Foreign capital inflows into an advanced economy (yes, we are still an advanced economy, phew) either cause more debt or more unemployment. Hence the RBNZ and RBA are forced to lower interest rates.
...But clearly there are expectations of interest rates being lower for longer. This will stimulate the economy.
Says you!
RBNZ cutting the OCR in half from 3.50% to 1.75%, over the four year period starting from April 2015, failed to "stimulate" to the right degree, hence a further 25 bp cut was recently called upon to rectify the situation. If that fails, what's next?
Here's a different view. The yield curve is bang on the money.
The driver is a house building boom that is in the process of going to the dogs. All of our other economic drivers ~ tourism, dairy, logs, services are all slowing down. New car purchases down, bankruptcies going up. Credit being tightened. Its all there as clear as daylight.
ANZ were calling the 10 year at 2.25% as recently as 6 months ago. They haven't got a clue.
ANZ were calling the 10 year at 2.25% as recently as 6 months ago. They haven't got a clue.
Exactly, and negative real yields for NZ government 10 yr notes are a disturbing signal for future economic stability. Those hoarding liquidity hedges want to get some capital back down the road despite the high haircut costs.
We welcome your comments below. If you are not already registered, please register to comment.
Remember we welcome robust, respectful and insightful debate. We don't welcome abusive or defamatory comments and will de-register those repeatedly making such comments. Our current comment policy is here.