
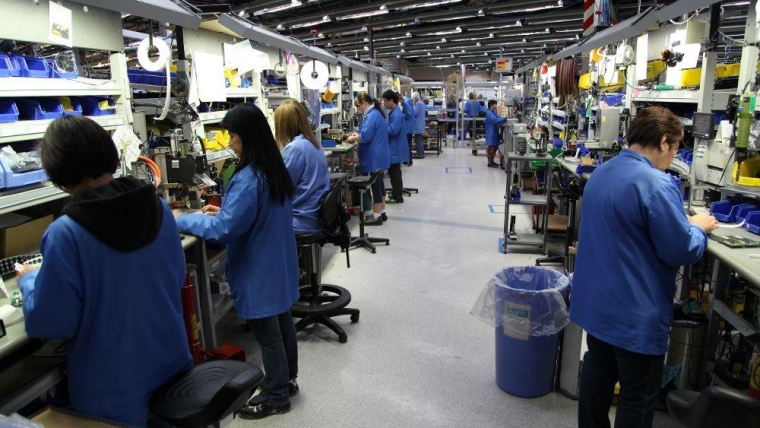
Globally the manufacturing sector is most exposed to the US-China trade war. Possibly related to this a useful leading indicator of NZ manufacturing production points to an imminent and reasonably large fall in non-food manufacturing production.
This Raving reviews the accuracy of this indicator - the BNZ-Business NZ manufacturing survey - and puts it in context. First, by a comparison with the insights provided by the BNZ-Business NZ service sector survey that is a useful leading indicator of service industries production. Secondly, by showing the relative importance of non-food manufacturing production versus service sector production to GDP growth. One of the main insights surprised me and will probably surprise most people.
The July BNZ-Business NZ survey points to tough times ahead for manufacturing
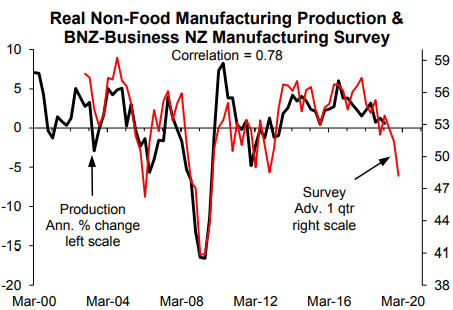
The BNZ-Business NZ manufacturing survey is a useful leading indicator of annual growth in nonfood manufacturing production (chart below). The peak correlation, at a respectable 0.78, is with the survey advanced or leading by one quarter. In July the survey fell to the lowest level since 2012 (48.2); pointing to the possibility of a 5% plus contraction in manufacturing production.
There have been a few cases of the survey spiking up or down and it not being followed by an increase or fall in manufacturing production. The fall may be partly due to random variation or some respondents may have decided to use it to give the Reserve Bank the evidence of slower growth it is looking for to justify more OCR cuts.
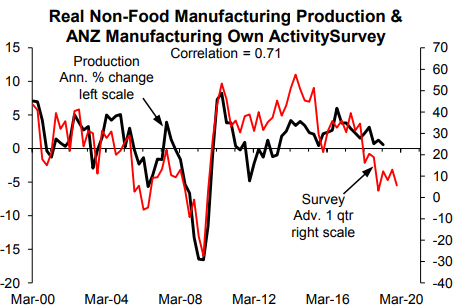
On the issue of bias, the chart below exposes the political bias in the ANZ manufacturing own activity survey that fell lots after the late-2017 election and has since then been hugely understating near-term prospects of growth in non-food manufacturing production. This survey also generally understated near-term prospects for manufacturing production during much of the former Labour Government's term and often overstated prospects during the last National Government's term in office.
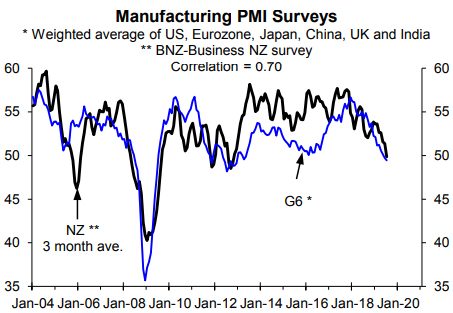
A reasonably good case can be made to suggest global factors are the main cause of the fall in the BNZ-Business NZ manufacturing survey that is reasonably correlated with a global equivalent (next chart). A reasonably high correlation is possible by chance. However, there seems to be a good case for suggesting the US-China trade war and the sizeable increase in international interest rates last year that has now been largely reversed are the main factors behind the fall in the NZ survey.
The BNZ-Business service sector survey is telling a different story about growth
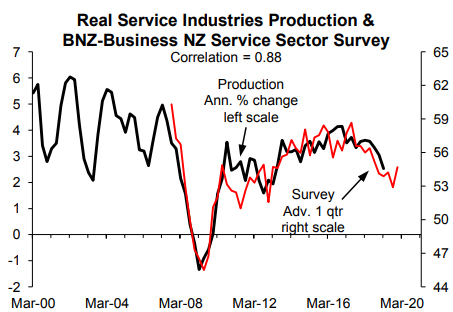
In contrast to the manufacturing survey, the BNZBusiness NZ service sector survey has nudged higher over the last three months and stood at 54.7 in July, seasonally adjusted, compared to 48.2 for the manufacturing survey. Since its inception in 2002 the service sector survey has been a quite accurate leading indicator of annual growth in service industries production (next chart). The peak correlation - 0.88 - is with the survey leading annual growth in production by one quarter.
If some respondents to the manufacturing survey started to tick the negative box to either express dissatisfaction with government policies or to give the Reserve Bank a nudge, this should probably have also been evident in the service sector survey; although maybe manufacturers are more inclined to mischief than service sector firms. It is still possible the tumble in the manufacturing survey is partly due to volatility but the case for this is undermined by the fall in the global equivalent.
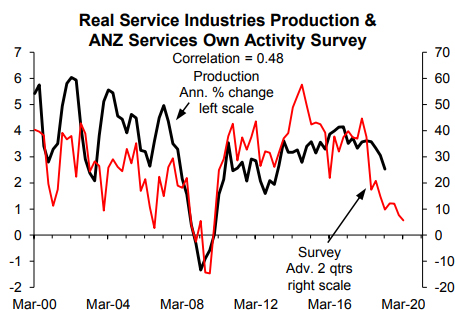
As an aside, the ANZ survey of service firms' own activity has, like the manufacturing survey, become highly political (next chart). It fell hugely after the late-2017 election and has since greatly understated near-term prospects for growth in service production; consistent with past political bias.
Will a 5%+ fall in non-food manufacturing production matter much to GDP growth?
A 5%+ fall in non-food manufacturing production isn't a great prospect and may fit with anecdotes some clients have provided recently. But even if it occurs the implications for GDP growth are much less than I would have expected. It turns out that non-food manufacturing production only made up 6.6% of total GDP over the last year. This was over double the contribution of food manufacturing but was only slightly higher than the construction contribution (6.1%) and was a pinch lower than the contribution of primary industries (6.7%). Of most importance, it was dwarfed by the contribution of service industries that was 66.9% (chart below).
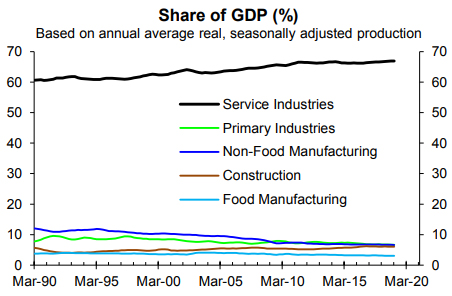
Potentially like many people I had assumed that the contribution of non-food manufacturing would have been quite a bit higher as it was in the past (e.g. 12% in 1989 before the demise started).
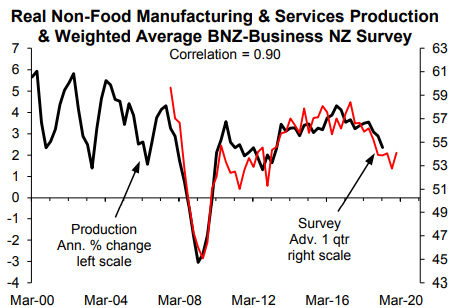
To put things in perspective I combined the BNZBusiness NZ service sector and manufacturing surveys using the respective weights of non-food manufacturing and service industries production in GDP. The result is the chart below that uses the weighted average of the two surveys as a leading indicator for growth in non-food manufacturing and service industries production. The peak correlation at a high 0.9 is with the survey advanced or leading by one quarter. When put in the proper context even the quite large fall in the BNZ-Business NZ manufacturing survey isn't particularly worrying for NZ GDP growth prospects.
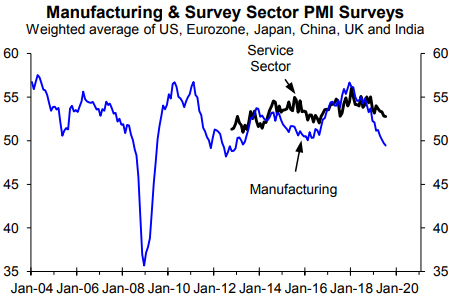
Putting the fall in the G6 manufacturing survey in the proper global perspective
For some countries manufacturing is a larger GDP component than in NZ but the G6 weighted average manufacturing survey has also fallen much more than the service sector one (next chart). However, factors that have driven the manufacturing survey down have still weighed somewhat on the service sector survey although it remains quite a bit above the "breakeven" 50 level.
This article is re-posted here with permission. The original is here.
We welcome your comments below. If you are not already registered, please register to comment.
Remember we welcome robust, respectful and insightful debate. We don't welcome abusive or defamatory comments and will de-register those repeatedly making such comments. Our current comment policy is here.