
By Craig Ebert*
There is a common perception New Zealand is indebted up to its eyeballs, to a degree approaching the likes of Greece, Portugal, and Ireland.
NZ certainly owes a disproportionate amount to foreign lenders.
However, its overall debt, relative to GDP, is toward the moderate end of developed-world standards, largely thanks to low government debt.
And while the nation’s private-sector debt is up closer to the middle of the OECD pack there are clear signs it has been abating over the last few years, in relation to ongoing growth in nominal income.
These assessments of ours spring from having read one of the more interesting papers from this year’s Jackson Hole Symposium.
While the forum had most punters hanging off every word of the world’s banking heads, a paper by Stephen Cecchetti, M. S. Mohanty and Fabrizio Zampolli (CMZ) was setting the scene as to what all the fuss was about.
Entitled The Real Effects of Debt, its abstract cut to the quick.
At moderate levels, debt improves welfare and enhances growth. But high levels can be damaging. When does debt go from good to bad? We address this question using a new dataset that includes the level of government, non-financial corporate andhousehold debt in 18 OECD countries from 1980 to 2010. Our results support the view that, beyond a certain level, debt is a drag on growth.
Quite apart from the paper’s topical insights and conclusions, we were most pleased to see its 'new dataset' (including the convenience that all debt measures were expressed relative to GDP). We had long wanted to get hold of such information, in order to benchmark New Zealand, but found it a labyrinthine task, ultimately a frustrating one. That such basic, but important, information as gross debt (and for so-called advanced countries) was so hard to get hold of seemed to us integral to the bigger problem at hand.
With the CMZ dataset now available, we’ve stitched together what we believe are comparably defined measures of debt for New Zealand.
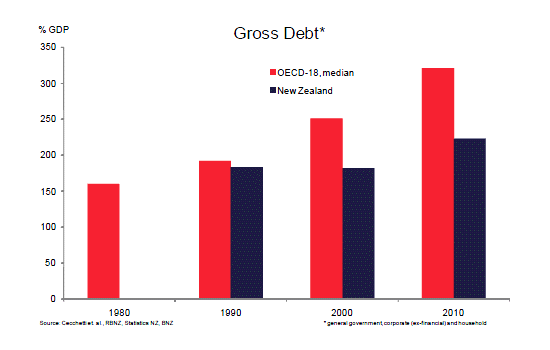
Of course, there are always going to be weighty measurement and conceptual 'issues' in such an exercise (more on that later). However, we thought we’d start by conveying its overall message. That is, the New Zealand economy is carrying less proportionate debt than the majority of its developed-world counterparts now do.
Of course, this does not mean New Zealand is absolved in any absolute sense, far from it. Let’s face it. We’re now comparing ourselves to a bunch of countries that look quite bad, debt-wise.
Still, the numbers do suggest the NZ economy has leveraged up far less than the vast majority of its developed-world compatriots over recent times.
Take a concrete example. The weighted-average debt-to-GDP ratio of the OECD grouping compiled by CMZ hit 307% in 2010, from 246% in 2000 and 215% back in 1990. That is, from double to treble leverage. Their median measure was even higher, at 321%. New Zealand’s total, according to our calculations, got to 223% in 2010, from 182% in 2000 and 183% in 1990.
One way of looking at this is that New Zealand’s leverage now is not even where the bulk of the OECD was back in 2000, before it went on the bender it did.
For more perspective on this, we note the CMZ analysis actually goes back to 1980. While this aids the econometric identification of debt stress/tipping points in countries, and sectors, it doesn’t much change the story that the biggest pile-up of debt came from the year 2001 onwards. This can certainly be seen from United States debt-to-GDP ratios that stretch all the way back to 1950, which CMZ also show in its paper. Something definitively changed through the 2000s (and not just in the US).
In relation to the CMZ 18-country OECD league table, we judge New Zealand’s gross debt ratio would sit toward the bottom of it, if not at the very bottom.
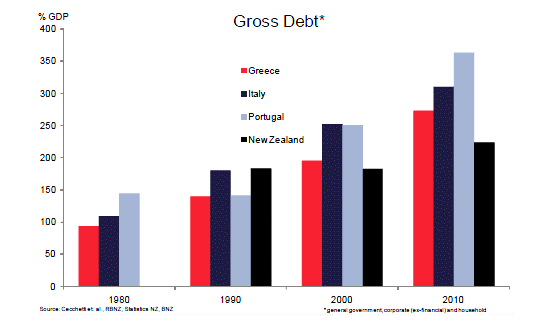
But as the current climate would recommend, we might want to compare New Zealand’s 223% debt load to Greece’s 273%, Italy’s 310%, Spain’s 355% and Portugal’s 363% (and counting). Ireland was the notable omission in the CMZ dataset, but we can well imagine it is keeping good company with the Club Med countries.
Most apparent from these comparisons, however, is that the countries currying the least favour right now are the ones with the highest government debt. Take Greece’s gross public debt of 132% of GDP, Italy’s 129%, and Portugal’s 107% - as at 2010. Contrast this with Germany’s 77%, and a 55-75% range for the various Scandinavian economies.
New Zealand’s public sector debt was about 33% the size of the economy in 2010. Sure, it’s on an increasing path, partly owing to earthquake costs. But it’s projected to peak well below 50% of GDP. Importantly, this includes local government debt, which is relatively minor, in the order of just 5% of GDP. This is an added reason New Zealand’s total public sector debt is well under the radar by OECD standards. Contrast this with regional government debt in many other countries that is high and rising, only adding to the well-publicised, but incomplete, picture provided by central government debt.
Of course, this implies that if there is an issue with New Zealand’s debt it is in its private-sector holdings. At first face there looks to be something in this. For example, New Zealand’s total “household” debt, as we measure it, hit 94% of GDP by 2010. This is little different to the OECD-18 average and, more to the point, is a zone of vulnerability in the metrics of the CMZ paper (which, for the record, tended to be around the 85% mark – whether household, (non-financial) corporate or government).
This, as it happened, left our measure of New Zealand’s corporate debt at 96% of GDP. While this was also seemingly a vulnerable level, it was at least under the 2010 OECD standard, of 113%.
However, there are always grey areas between what constitutes the household sector as opposed to the corporate one, and especially when it comes to New Zealand. A cursory way of getting around this is to simply aggregate the two into a private-sector debt ratio. Doing this yields a ratio of 190% for New Zealand. This is the right side of the CMZ OECD weighted-average of 203% and median of 220%.
However, the more interesting, and potentially important, stories lie in the finer detail; which leads us into the heart of some of the gnarly measurement issues, as alluded to earlier. Bear with us.
For a start, to best align with the CMZ measure/concept of household debt we should probably have to bring into ours a portion of our business debt measure, on account of it being unincorporated, strictly speaking.
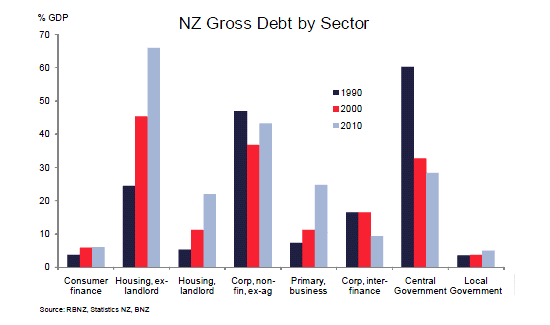
However, rather than doing this, we believe the bigger issue is that we probably need to shift a good chunk of our household debt measure over to business debt. This relates to a good portion of housing debt being sheeted to residential rental property. This is arguably business-related debt, even though only a minority of it is actually held in corporate (tax) structures. The higher proportion – that is, mortgage debt related to rental properties, but formally non-incorporated – could comprise an amount as much as 25% of GDP.
Then there is the component of household debt which, while also secured against housing assets is, in effect, used to fund small businesses – a sector that is disproportionately large in New Zealand’s case.
This, by the way, is partly the consequence of New Zealand not having particularly deep financial/capital markets, with the sector heavily represented by the core banking sector, by default.
The silver lining in this is that it makes it easier for one to get a steer on New Zealand’s debt measures, in that the vast majority of it is intermediated through the registered banking sector. This is not the case for many other advanced economies, where non-bank sources can be significant. Not that this was a big problem for CMZ, in that they were able to come at their debt measures from the top down, by way of national flow-of-funds accounts and financial balance sheet data for almost all countries. Unfortunately, these types of accounts are lacking in the case of New Zealand.
Anyway, getting back to the specifics, shift New Zealand’s small-business and rental-property household debt across to the corporate sector and the household debt ratio in all probability falls below 70% of GDP. This is well south of the twilight zone estimated by CMZ.
But this reapportioning would only be to push New Zealand’s corporate debt measure above the latest OECD norm.
And one of the key reasons this measure is as high as it is anyway, and has risen over recent years, is that its agricultural component has burgeoned. Specifically, primary sector debt – predominantly agriculture, but including forestry and seafood – hit 25% of GDP in 2010, from 11% in 2000 and 7% in 1990. That’s a fair bit of leveraging up, even for a primary sector as big as New Zealand’s.
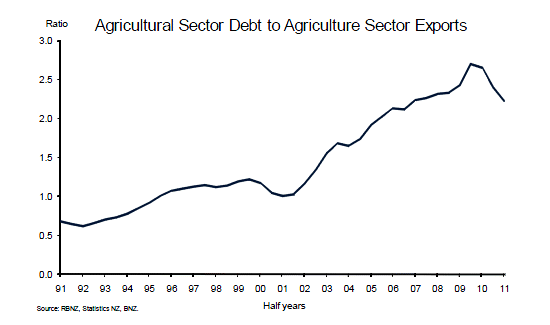
Thankfully, however, the industry has a lot to show for it, at least in terms of income. With New Zealand enjoying its loftiest rural incomes in decades, in spite of a recently strong currency, the ability to manage debt – in terms of both paying it down and servicing the remainder – is greatly enhanced. In this respect, we note that rural debt relative to export receipts has subsided to a material degree over the last couple of years.
The other thing to realise, for a business-debt measure that could be construed as high, is that a great chunk of it is borrowing from international parents, potentially over-wrought by tax policy. We were reminded of this when referencing the International Investment Position accounts to help judge the amount of NZ business debt not intermediated directly through the local banking sector.
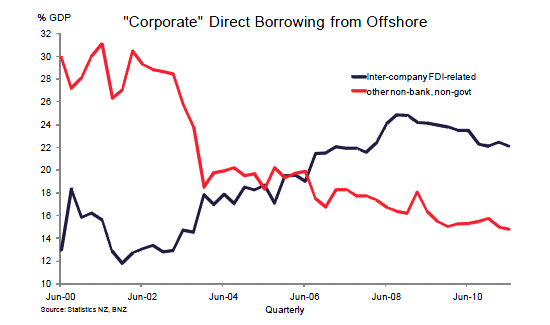
This showed that of the nation’s total gross foreign debt of $254b (as at June 2011), $74b of this did not involve local banks or the Government - so was, in essence, mainly private businesses borrowing directly from offshore entities. But of this $74b, $44b was within the dominion of a foreign direct investment relationship. That is, borrowing from one’s parent. This amounted to 22% of GDP in June 2011, almost double the proportion of 2001.
This is not to say we can expunge this amount from New Zealand’s debt figures. More that one needs to understand it for what it is.
Of course, there is the added argument that borrowings from international parents have been structured to the high side, simply to take advantage of thin capitalisation tax rules regarding interest deductibility. Better debt than equity. Interestingly, the Government, in its 2010 Budget, decided to reduce this tax advantage, taking effect from the 2011/12 income year. Whether this results in a paying down of FDI-related debt, accounted for on local subsidiary balance sheets, will be interesting to keep note of.
In the least, we know that, with reference to RBNZ data, business debt as intermediated directly through the banking sector has flattened off over recent years. As has the private amount raised directly from foreign sources. This suggests a broader reduction when related to (increased) income, or profits. This would align with anecdote that corporate balance sheets in New Zealand have come through the most recent recession in remarkably good shape (unlike through the late-1980s and early-1990s recession, when they were severely afflicted).
The other sign that private-sector balance sheets are now in better repair comes from the household sector. Even if one concludes NZ household debt should rightly be loaded up with mortgage debt that is, in practice, related to rental property and small business operations, there are indications it’s on an abating path, overall.
Inkling to this is given by the Household Income and Outlay Account, which implies that a serious improvement in the personal savings rate is well underway (much like we know has occurred in Australia from its timelier, and better-trusted, data).
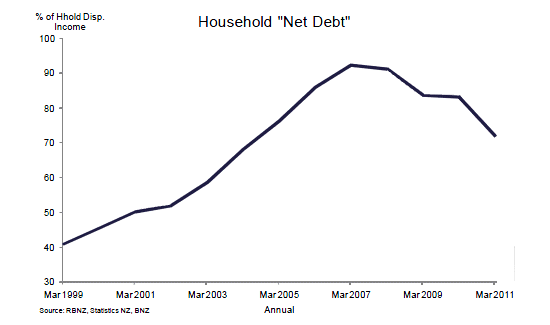
This fits with the fact household deposits in the NZ banking system have been picking up. In July they were up 8.3%, or $7.7b, on a year ago. This, combined with gross household debt that has been largely capped for a number of years now, infers a net debt measure that has clearly abated since 2007, in relation to greatly improved household disposable income.
Of course, this doesn’t mean the economy has de-leveraged enough; potentially, not by a long chalk. Only more time will tell on this matter.
Even if one can forecast debt loading with some accuracy, measure it fully, and apportion it properly across the various sectors, there are conceptual issues to bear in mind as well.
Gross debt, for instance, says nothing of the other side of the balance sheet, in terms of either financial or physical assets that the debt might have helped generate, secure or leverage off. Related to this, financial innovations over the decades have patently allowed balance sheets to be run bigger, both sides, and with equity put to work better.
Inflation control, meanwhile, has served to cap nominal interest rates, which has afforded higher gross debt loads than would have been the case if the highly inflationary times of the 1970s and early 1980s had been let persist.
Still, such things can excuse the upward tendency in (global) gross debt proportions only so far. The asset side of the balance sheet, it can also be argued, should be reflected in (income) GDP measures over time, which should, in turn, help keep ratios of gross-debt-to-GDP in check. And as much as low inflation can help cap debt servicing it also means nominal debt holdings can’t be inflated away in any hurry.
In any case, there is now clearly a sense of debt being just too big an issue worldwide to try to sweep under the carpet. Those who are trying to do so are getting punished. Debt has fast become a four-letter word. Proponents of debt super-cycles, which infer the rich world has, in effect, reached the very end of its tether, can smell blood. The financial markets are doing so as we speak. This is reason enough to not overplay supposed excuses on high-looking debt loads.
Nor are the emerging-market economies especially immune from this scrutiny. Indeed, there are indications that debt ratios to GDP have surged quite a bit throughout the Asian region over the last few years. Indeed, that they are revisiting the sort of proportions that proved highly problematic during the 1997/98 Asian Financial Crisis.
Still, we are encouraged by New Zealand’s relative standing in all of this. Its gross loading, while higher than it was 10 years ago is not nearly as high as it has become for most of the rich world we like to compare ourselves against. And, importantly, this reflects low government debt. Even in respect to lofty-looking private-sector debt, understanding the details gives more encouragement than concern while there are signs that business and household debt proportions have each been abating for a number of years now.
We might even suggest that one of the reasons for New Zealand’s relative economic resilience over recent years, banking sector included, has been its debt load which, while on the high side, did not get as extreme as it has for most other developed nations. And why the NZ economy hasn’t required, and doesn’t counsel, a crazy low policy interest rate in order to get through.
Indeed, one could venture New Zealand’s relatively low gross debt (by latest developed-world standards) is testimony to our central bank, over the many years, being less inclined than others to run ever-lower interest rates in the misguided attempt to obviate necessary, healthy, economic corrections from occurring.
We have arguably been more inclined to take our medicine, without resort to gigantic gobs of debt (rather like Australia, in this sense).
Those who have long complained about New Zealand interest rates being “far too high” might thus want to think about the sort of debt the nation might otherwise have taken on.
When it comes to New Zealand’s actual debt position, we believe some credit is due.
--------------------
Craig Ebert is a senior economist at BNZ Research and you can contact him here.
8 Comments
Craig Ebert notes ,"Gross debt, for instance, says nothing of the other side of the balance sheet, in terms of either financial or physical assets that the debt might have helped generate, secure or leverage off" and herein lies the rub. The graph of Household " Net Debt" ( his parenthisis) is enhanced dramatically by the surge in property prices over the last +10 years that have disguised the amount of Gross Debt the public has. Any downturn in property prices, a likely even in my view, will see our household net debt ratio head up markedly. Given the Fitch downgrade today, I can only conclude that we have more of the same to come, with a viscious circle of higher net household debt, higher mortgage rates and lower resultant property pricesresulting. The real issue comes if we fail to hang on to our Gross Debt funding facilities at a reasonable price. The we turn into the worst of the OECD comparisons.
Very good analysis and touches on the fundamental question as NA highlights - the diminishing productivity of debt. Forty years plus of debt rising faster than productivity. The prescription - a global deleveraging - is simply not possible. Our debt based monetary system makes it impossible without widespread bankruptcies or, alternatively a major rise in productivity from a groundbreaking new technology or new energy source. We've already enlarged the global workforce (more woman and developing economy workers) introduced robots and computers, new energy sources (nuclear, cheap oil) But still the global debt to GDP climbs higher still. What's up?
It would be good to have Graig explore these issues a little more.
All very comforting.
However, Ebert conveniently doesn't discuss net debt, where NZ is clearly a global cot case.
NZ has got very little investments overseas. So we owe foreigners a truckload of $$, but we have failed to lend money overseas, unlike other countries.
This is a consequence of our taxation policy, which taxes investments held overseas, but provides a generous sweetheart deal for domestic investment in property, with debt being tax-deductible but the asset not usually being taxed (no land tax or CGT).
This dream deal is why we have such an enormous rental property sector, which gathers for NZ not a single cent in overseas revenue.
Ebert prefers to croon gently to us, to tell us that all is well, which protects the incentives for NZers to take on ever more debt, benefitting who else but .... the banks!
Cheers to all.
So called 'economics experts' always make me laugh. They go on about the need for saving and reducing debt whilst at the same time telling us we must have economic growth, which is exponential economic growth. They fail to mention that you simply can't have both. For an economy to grow, it's money supply must grow with it. The only way new money can be created is for it to be 'borrowed' into existence by way of bank credit, either as public or private debt. So for economic growth to occur, debt must increase. If we reduce private sector debt, then the economy can only expand by increasing public debt and vice versa. If new money isn't constantly borrowed into existence then the economy will shrink and go into recession as the money supply contracts. This is why our GDP growth has stalled at the moment, people are saving money, businesses aren't spending, so government is borrowing more to try and keep us out of recession. Saving is not good for the economy. If all people, businesses and government paid off all their debts and owed nothing to anyone, you'd be forgiven for thinking that that would be a good thing, but in reality it would mean that there would be no money in existence. Either way, the bankers win in the end.
"This is why our GDP growth has stalled at the moment, people are saving money, businesses aren't spending, so government is borrowing more to try and keep us out of recession."
Are you sure? I see GDP growth & stable govt debt since 2013. And, importantly, low inflation.
I see your point re money supply however it is not something neglected by economics experts. The 'quantity theory of money' was a primary focus of Keynes through to the Monetarists. Our current monetary policy is largely a result of this line of thinking.
Most economists, however, I think would argue that growth is possible with fixed money supply but that it would be therefore be deflationary in long term (all other things remaining equal). Take a look at 19c economic history to see an example of this when gold supply, therefore money supply, was stable but they had productivity growth and therefore deflationary pressures.
We are not in that situation as have continued credit growth, and RBNZ reducing rates to encourage this credit when the output gap falls. In addition to total debt, consideration also needs to be given to impact of money supply, multiplier effect (impacted by reserves requirements), velocity and of course time (differing impacts on differing time horizens).
Can you not have GDP growth and low credit growth? it will just not be inflationary. Productivity growth with low inflation and low credit growth may be ideal.
Thanks for that Craig, I have also had trouble calculating NZ's total gross debt.
200% of GDP is way too high, but it must not be allowed to drop. Think about interest rates, and even Govt debt at 4.5% interest, that requires 9% of GDP to service, every year. Though I imagine the total interest paid would be more like 12% of GDP. With anemic lending growth in NZ, this interest is being sucked out of the economy. And into the balance sheets of banks and depositers, and if this money is not released back into the economy through lending, the money available to repay debt shrinks, bankruptcies will naturally follow if we continue down this track of deleveraging.This is the greatest failure of the monetary system.
The monetary system was dreamt up by economist's using philosophy, which is why it is so full of problems for humanity. Economists are visibly failing to contain the problems inherent in the system, that has been thousands of years in the making. Humanity has evolved and become far more sophisiticated since money was first created, it is nearly time to move on from the monetary system. Economists and Politicians lack the tools and the will to move forward. We need a social system based on the only discipline that is always looking for truth, Science.
A good read, as always from Craig. A reminder that we are in the 'least-worst' group of indebted countries.
There is good government debt such as for (1) for infrastructure funding if rates of return exceed cost of funding (long term funding, matched to asset), and (2) smoothing of cycles (medium term debt).
And there is bad government debt such as for funding of non-capital expenditure & infrastructure projects where rate of return $1 return than we would expect much higher debt levels. Over capitalisation is as much as issue for govt as it is for households or businesses, and without debt undeveloped countries may never be able to fund much needed infrastructure project.
Personally, I believe we are not the 'undeveloped country' many in NZ think, and therefore we should not have increasing sovereign debt levels. That is a view with little factual evidence so if anyone can point me to a Treasury or Infrastructure NZ link that suggest infrastructure spending in NZ still has significant returns I will change my mind.
However, I strongly disagree that surpluses should therefore be returned to households in form of tax cuts such as current govt has recently done. A better option would be to build a sovereign wealth fund. Yes, we have the NZ Super Fund but we need to be much more ambitious.
We know that we have a systemically bad savings record and that we heavily favour property as an asset class. In a theoretical world, we should be able to leave savings and investment decisions to agents; we should see savings rates improve overtime as there is marginal utility for household to save vs spend, and we should see investments in other asset classes as they return higher than property. However, the reality is that these are behavioural issues. The libertarians will not agree but in general we have proven ourselves to be irrational consumers who can't be trusted to spend, save or invest money in a way that is net beneficial for either the country or ourselves as individual agents.
This could not be more true than if we look across generations and consider the trend to a more automated world where capital returns more and labour less, esp for lower skilled jobs. If this was being considered now by individual agents then parents would be building capital funds which include wide equity class so that they and their children can benefit from further automation and hedge against lower wages. We know this will not happen. It’s a pipe dream. The wider population will not have a stake in capital returns if they have no savings and therefore a way to share in capital returns is through a sovereign wealth fund that invests globally in index equities. Something that many commodity rich countries already have, such as Norway ($900b), but also Singapore ($350b) and China ($813b) to an extent (although considered fx reserves more than pool of funds to share in capital returns).
We welcome your comments below. If you are not already registered, please register to comment.
Remember we welcome robust, respectful and insightful debate. We don't welcome abusive or defamatory comments and will de-register those repeatedly making such comments. Our current comment policy is here.