
By Yu-Ming Wang and Chris Rands*


Many investment ideas are based on ‘reversion to the mean’ as a principal tenet. This is because averaging is the first arithmetic operation we all learn that allows us to draw quick statistical conclusions, knowing that the ‘Law of Large Numbers’ will give us the statistical comfort of diminishing error.
The trouble is that, when there are structural changes, simple data averaging often leads to wrong conclusions.
This paper will focus on understanding the persistently low inflation readings in most developed economies and seek an alternative explanation as to why the vaunted Phillips curve is not working.
NAIRU: just around the corner?
Traditional economists have been trained to believe that as unemployment rates fall below NAIRU (the non-accelerating inflation rate of unemployment), wages and thus the general inflation rate should begin to rise. Firm conviction in this inverse relationship between unemployment and wage inflation led the Federal Reserve (Fed) to remain on a hawkish path and vote for its fourth rate hike on June 14.
Conversely, this thinking appears to be falling out of favour with investors. The bond market in particular seems unconvinced, with the Treasury Inflation-Protected Securities (TIPS) breakeven rate (a proxy of expected inflation) recently reaching six-month lows.
In response, economists point to the fact that NAIRU is both exceptionally hard to observe and calculate, making it difficult to determine when it has been reached. In addition, there could be more than one NAIRU with different levels based on factors such as industries, states and educational requirements, which raises the question of which NAIRU we use and how we apply it. Furthermore, economists are increasingly raising the possibility that the Phillips curve faces a ‘kink’, and once unemployment falls below a certain level, the inflation rate will rise disproportionately.
Thus while we have not seen the effects of this relationship flow through to inflation, many believe that these factors are causing inflation to lie dormant and we will eventually see the inflationary spike that central banks have been referring to. Because of these hidden factors, we cannot dismiss the fact that this relationship could exert itself in the near future and prove to be a correct interpretation of the world.
The demographic explanation
Looking at the issue from another angle, we know that populations in developed economies are aging rapidly. Data also tell us that the working population as a percentage of the total population stopped rising around 2015 and began to decline as shown in Chart 1 below.
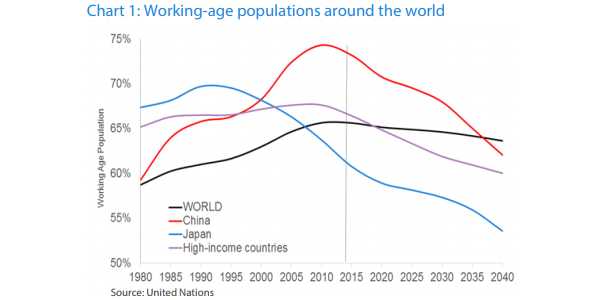
In fact, most of the growth in the working population since 1980 came from the integration of China and its relentless rate of urbanisation. China’s working population peaked around 2010 and will begin to drag on the percentage of the global working population, although this will be partly mitigated in the near term by the continued shift of rural workers into urban cities. Still, this has a negative implication for global economic growth over the long term, unless governments can sum up the courage to reform labour laws and raise retirement ages.
In the US, surveys by the Bureau of Labor Statistics (BLS) show that the segment of workers aged above 55 has expanded from 11% in 1996 to 22% in 2016. The older working population has doubled, while the younger population has significantly declined.
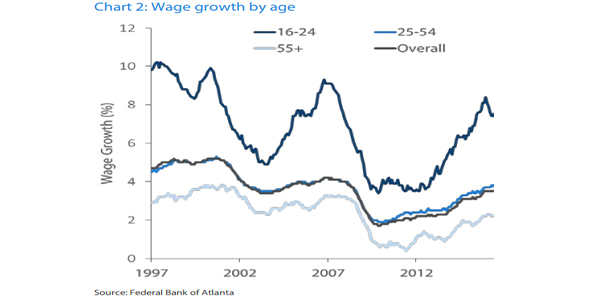
When wage data is mapped to age groups as shown in Chart 2 below, we can make two observations. Firstly, younger workers experience more wage volatility, but have largely recovered from the steep declines of the Great Recession to achieve 8% wage growth. Secondly, the 55+ age group has historically received lower wages but has also seen wages stagnate and remain far from full recovery. According to the BLS, workers in this age group tend to stay with the same employer for more than ten years1 , compared to workers in the 25-34 age group, who tend to switch jobs every three years. The wage stagnation and longer tenures are strong evidence of aging workers’ lower negotiating power in recent years.
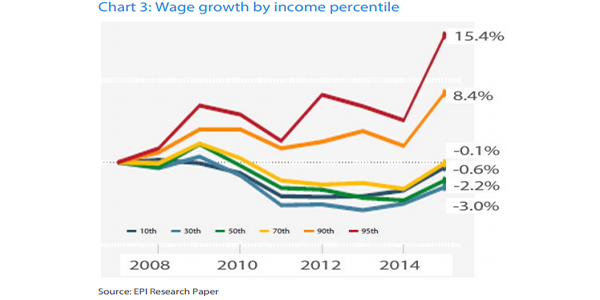
Other interesting observations of unequal wage treatment can be made when the data is stratified by wage bracket and education level. The top 5% of male earners saw cumulative wage growth of 15.4% since the Great Recession, but the median has only recently recovered while the bottom decile saw negative growth, as shown in Chart 3.
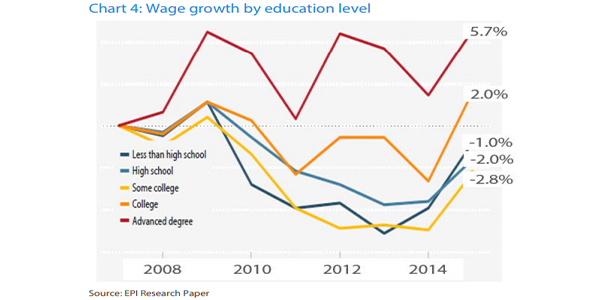
Similarly, Chart 4 shows that the most highly educated segment has seen healthy wage growth, while the least educated has lost ground. This polarisation of earning power by age, income, and education is completely masked by the relative stickiness of the median worker’s wage growth. In other words, the median worker has lost wage negotiating power, while the high earners have benefited from rising wage inflation. This is likely exacerbated by declining union membership2 which would have previously allowed low wage earners to demand higher wages as a collective group, rather than on individual merits.
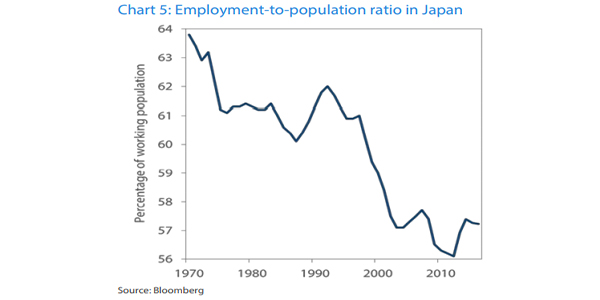
Japan’s experience during its lost decades provides an example of the median worker’s loss of wage negotiating power as labour adjusts to diminishing employment. While Japan’s unemployment rate has never exceeded 5.5%, the labour force participation rate has steadily declined, leading to lower employment-to-population as depicted in Chart 5.
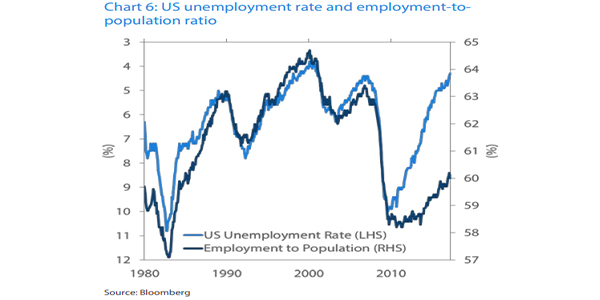
The same explanation applies to the phenomenon observed in recent US labour statistics, in which the unemployment rate has fallen through NAIRU but wages continue to stagnate. The reason lies in the large number of people (about 4% of the population) who gave up on seeking employment since 2007. The employment-to-population remains well below prior cycle highs, as seen in Chart 6 below.
Winner-take-all economies
A similar phenomenon of concentrating power can be observed among listed companies. Much has been written about the increasing monopolistic power of the FAANG stocks (Facebook, Apple, Amazon, Netflix, Google) and their outsized returns. Research has found that larger and more profitable companies have continued to see improving profit margins in recent decades, while the lowest quintile has plummeted in profitability3 .
Jason Furman and Peter Orszag have shown that the proliferation of "winner-take-all" markets has produced greater monopoly rents for a narrow set of companies4 . This may explain why profit margins for large-cap tech companies have risen significantly over the past decade, despite a deceleration in productivity growth. They found that with regard to equity returns, the distribution among publicly traded corporations appears to have grown more skewed to the high end with time (1996 versus 2014, two roughly comparable years in the business cycle), as shown in Chart 7.
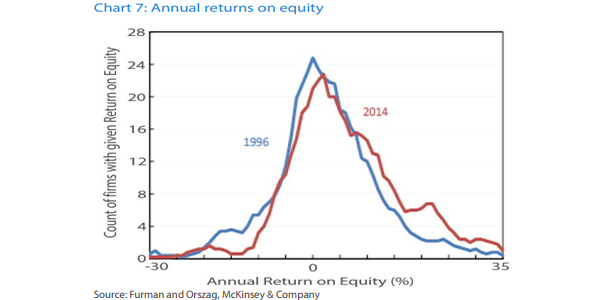
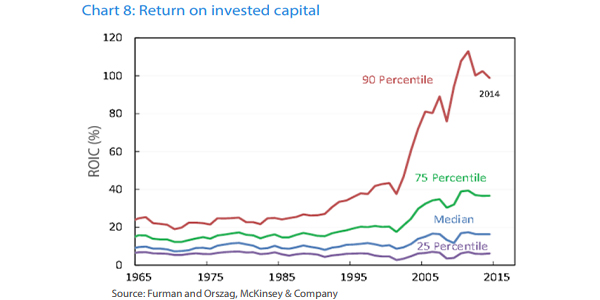
Chart 8 presents the distribution of the return on invested capital (ROIC) for publicly traded non-financial US firms from 1965 through 2014. As the chart shows, the 90th percentile of the ROIC across firms has grown markedly since around the early 1990s. The 90/50 ratio—that is, the ratio of the 90th percentile of the distribution of capital returns to the median—has risen from under 3 to approximately 10. Furthermore over the past 10 years the Bureau of Industry and Security (BIS) reports that the number of companies unable to meet interest payments from earnings have doubled from 5% to 10%5 . Thus, while there are clear winners who achieve healthy returns, there is also a growing share of companies returning nothing on their capital.
Knowledge is the new capital
Modern economies are transitioning away from producing goods towards producing knowledge. Companies such as Google, Apple, and Netflix have thrived without having to undertake massive amounts of capital spending. The price of capital goods has also tumbled over the past three decades, suppressing the inflation rate. The new form of capital is supplied by knowledge workers who are driving innovation and value creation. Knowledge workers are in short supply, and thus earn super-normal wages.
Today, the companies that are most skillful in transforming knowledge into value added services are earning very high returns on this capital. In such a ‘winner-take-all’ economy, the average wage and average inflation rate lose their relevance, because abnormal returns are accruing to the top end of the value pyramid, leaving the rest in stagnation.
To conclude with a fresh look at the Phillips curve, the concept of a trade-off between unemployment and inflation was made popular during the stagflation of the 1970s. This principle has since influenced the thinking of an entire generation of central bankers. However, over one hundred years of inflation experience in the United States shows that this trade-off relationship is more tenuous6 than economists would have us believe.
This brings us back to the main thesis of this paper: that averaging may oversimplify, and it may be problematic to rely on mean reversion in situations where the mean could have ceased to be relevant.
Yu-Ming Wang, Global Head of Investment and Chief Investment Officer, International at Nikko Asset Management and is based in Hong Kong. Chris Rands, Portfolio Manager, Fixed Income at Nikko AM is based in Sydney. This article is here with permission.
2 Comments
all theory has its time .... bring on the robots ... i need more time...and with the introduction of policies such as the on market participation of BOJ it is apparent that we may see completely new economic policies being developed to cater for a world where people may be helped along by robotics..I dont expect the NZSO to have any applications from robot players just yet.. thankfully as i do prefer live performers!!!!
Good article. Coupla cautions:
- Knowledge work, especially in IT, digital media, comms etc, is notoriously fungible. So the vaunted 'higher the education, higher the wage (salary + benefits, shurely)' meme is in practice limited by the ability to transfer that there work to a Cheaper Jurisdiction, quite often at the speed of light.
- The 'FAANG stocks (Facebook, Apple, Amazon, Netflix, Google)' and their underlying companies could disappear from the face of the planet tomorrow, without causing a ripple in the production of Food, Shelter, Transport and Security (the Maslow hierarchy, albeit jumbled and amended). So the examples, while impressive, do not necessarily relate to anything much beyond current fashion. Whereas FSTS is eternal...
We welcome your comments below. If you are not already registered, please register to comment.
Remember we welcome robust, respectful and insightful debate. We don't welcome abusive or defamatory comments and will de-register those repeatedly making such comments. Our current comment policy is here.