

This weekend Top 10 is a guest post from Matt Nolan, an economist at Infometrics, and a contributor at the blog site TVHE.
As always, we welcome your additions in the comments below.
If you're interested in contributing a Top 10 yourself, contact gareth.vaughan@interest.co.nz.
See all previous Top 10s here.

After a four year hiatus from looking at current New Zealand economic indicators I was interested in what has been happening here. From conversations with friends whose views on the economy I have a lot of respect for, I’ve heard the NZ economy is currently "late cycle but with low inflation and interest rate outcomes". This is pretty interesting - a situation with low inflation and interest rates late in the economic cycle isn’t what I’d typically expect.
Here I’m going to discuss the Top 10 freely available indicators I’m looking at to try to work out what is going on with the New Zealand economic cycle using my basic economic knowledge. For some perspective I’ll be comparing the figures from 2010-2018 to the data from 2000-2008. However, I have read nothing from NZ macroeconomists - so feel free to share links that extend on what I discuss in the comments. After submitting this I am heading over to see my buddies at Infometrics Ltd to get some answers to the questions that crop up below.
This is not an analysis of what is happening - this is just an outline of the data using the idea of “late cycle” to see how now fits. Hopefully sharing my process of learning will be interesting for some readers.
What is late cycle? It is a situation where factors of production (workers, capital) are being used but their cost is being pushed up. The corresponding tightening in margins leads firms to start cutting output (or at least reducing growth in it) taking us down the path of a typical economic slowdown.
1) Price growth and inflation expectations.
The first piece of information I want for judging the economic cycle is inflation outcomes. Let’s look at CPI.

Growth in CPI, or inflation, has been consistently lower during this cycle relative to the previous cycle - other than a GST induced bump in 2010/11. With inflation never really heading above its average target of 2% there has either been a situation where the RBNZ has had strong control over inflation outcomes or there wasn’t a typical upswing associated with an economic cycle.
To reinforce this we can look at what is going on with inflation expectations by households and firms/experts.

Again, there are two ways we can interpret this slight lowering of inflation expectations over the past four years. Either inflationary pressures aren’t behaving like we would normally see during a “late cycle” period, or the RBNZ has strong control over inflation outcomes and expectations in New Zealand.
To interpret this with regards to late cycle we need to check other measures of price growth (namely labour costs), but we will come back to that.
2) The OCR and interest rates.
Given the tepid inflation outcomes we also need to outline where the OCR and interest rates are before we look at more economic data. One question we need to ask is, has something changed such that a low looking OCR like 1.75% doesn’t actually point to nominal interest rates that were as low as they used to be? So what have mortgage rates been doing - let's grab the data from the RBNZ site.

Over this entire cycle interest rates haven’t needed to rise - in fact rates have continued to fall in line with reductions in the OCR and OCR forecasts. The introduction of LVRs and continuing strengthening of macroprudential policies will have tightened monetary conditions at the same time, indicating that maybe interest rates aren’t giving us the best steer on where monetary policy is positioned. As a result, we are going to have to look at a bunch of other indicators to see what is going on.
Before anyone says anything - there are no house prices in the indicators I am looking at here. Strong house price growth functions in the same way as a lower interest rate, so in terms of a principle it fits into this same point. Given that my interest is on the outcomes from house prices for the “economic cycle” - the stock of debt, consumption trends, residential building.
This does not imply that house prices and housing affordability are unimportant - of course they are for social and economic outcomes that we care about. Instead, I just don’t need more information on them for the specific question I’m asking about the economic cycle.
3) Consumer and business confidence.
Given inflation and inflation expectations aren’t telling us much, we can next turn to consumer and business confidence. If it is late cycle both of these measures should be turning downwards, especially business confidence.
On the face of it business confidence has declined sharply, and consumer confidence is bumbling around average. For this I am relying on ANZ (business confidence) and Westpac (consumer confidence) measures - but as reported by trading economics.
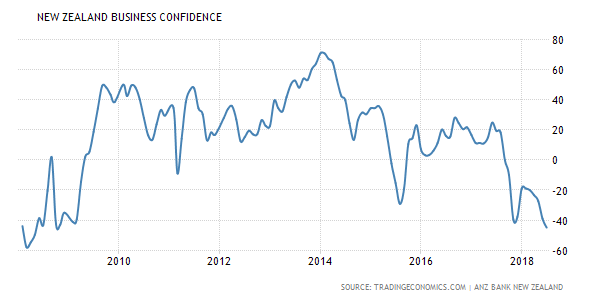
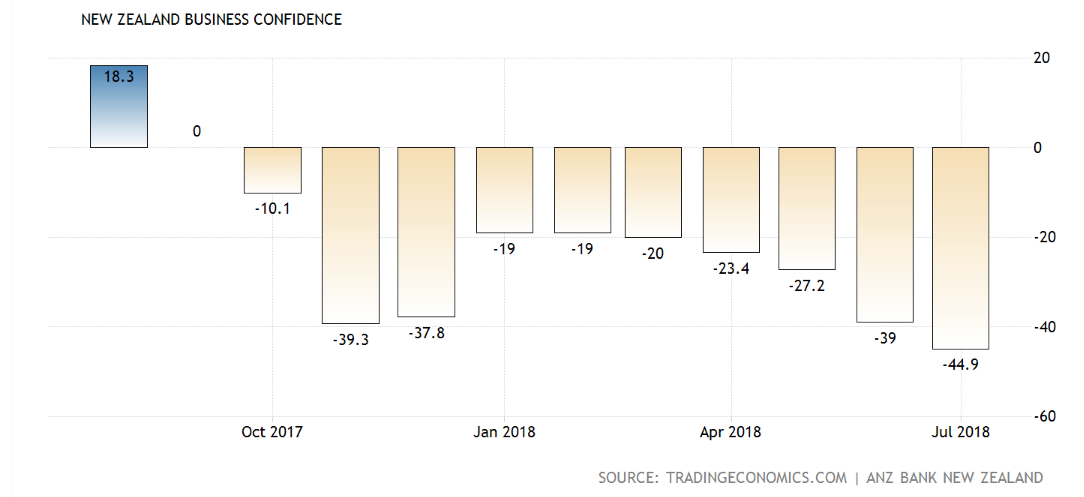
https://tradingeconomics.com/new-zealand/business-confidence [link]
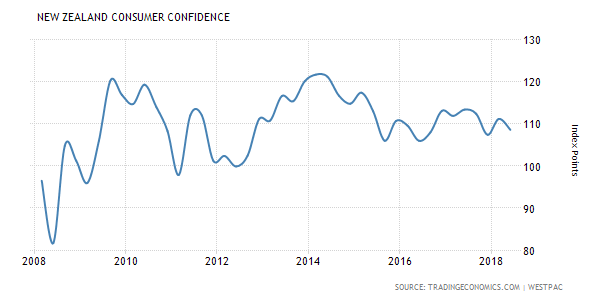
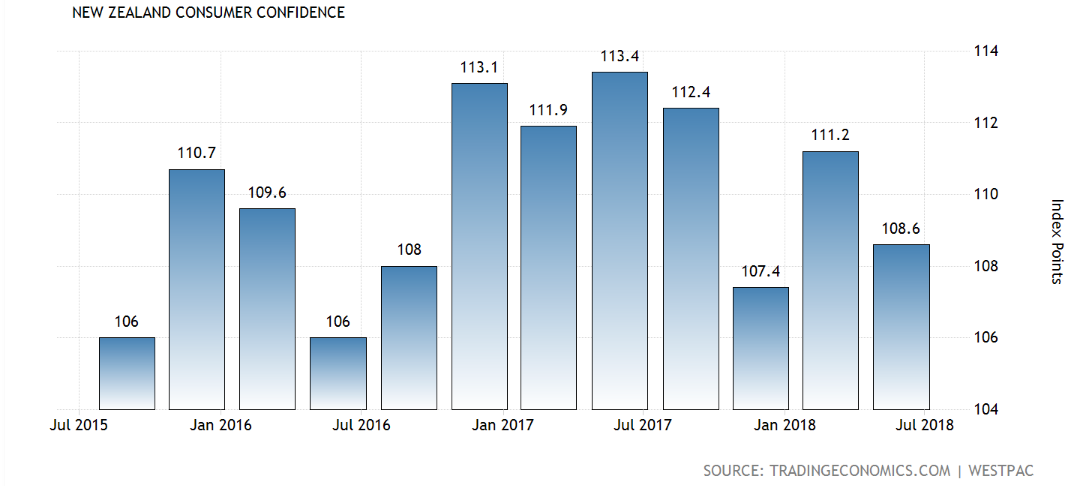
https://tradingeconomics.com/new-zealand/consumer-confidence [link]
However, with all these measures the key point of interest is how businesses and households feel about their own situation. For business confidence this is the own activity measure, which ANZ reports has deteriorated during 2018.
So these free confidence indicators don’t seem to be telling me too much - especially if it is true that part of the decline in business confidence is mainly about regulatory uncertainty, and so has little to do with firms' true intentions to do anything. Let’s dig into the real economy data now.
4) The labour market - quantities.
If we are late cycle then it makes sense to start our real economic analysis with the labour market. At first glance this may make no sense - if I care about the cycle I should actually look at GDP. But before doing that I want to check out what is happening with unemployment and participation rates.
What do I expect if we are late cycle? Unemployment below the “natural rate” (somewhere between mid 4% and 5%) and high participation rates - but with both plateauing. Looking at annual averages of this data from the HLFS what do we have?


Two things strike me. Why has unemployment only grudgingly gone below 5% in the past year, and why are participation rates so so high? My first guess was that the gig economy (eg Uber) may be moving people into part time work who previously weren’t working - but part time employment as a percentage of total employment has actually been falling!
With participation rates so high and suggestions that firms are finding it hard to hire both skilled and unskilled labour (this is what I’ve been told NZIERs QSBO shows, but that is not a free indicator so I don’t mention it here), this should be pointing to a normal cycle - with the associated increase in labour costs. That takes us to the next point.
5) The labour market - the cost of labour.
Ok, given these quantities in the labour market we need to ask about the price side. If it is “late cycle” there is normally a dynamic where factor prices (including labour costs) are climbing, contracting margins and leading to firms turning away from hiring and considering ways to reduce costs. Note: This isn’t the same as wage growth - as it is the cost in terms of the output produced by a worker.
So what is happening with labour costs?

Immediately the lack of labour cost pressure tells me there is something else going on here. This does not look like a normal economic cycle where these cost pressures accelerate.
However, when we talk about factor cost pressures rising we are thinking about them increasing relative to product prices! So we can take a look at the Producer Price Index from Statistics New Zealand to get some context. The output (input) index can be used to consider growth in the average price received for output (the increase in the cost of non-labour and capital inputs) for firms. This figure will differ from consumer prices as it includes the sale of all goods and services - including sales to other firms.

Looking at this - specifically for the last year - leaves me uncertain why labour cost growth remains so weak. I’d hazard a guess that this has something to do with the high participation rate - but that just kicks the explanation can slightly down the road. Let’s carry on.
6) Real GDP and the components.
Now I’m prepared to actually look at the real GDP data.


So real GDP growth has been solid - above 2.5% for several years. However, during the last year GDP growth per capita has been in somewhat of a funk, as high population growth (due to migration) has masked this slowdown. This looks like the late cycle slowdown people have pointed to - and by only looking at the GDP data (and not considering factor costs) it fits the idea that unemployment will start to rise. However, the fact that labour costs did not climb at any point plays on my mind when looking at this data!
With real GDP it is also nice to look at components. The two I like to look at ask specific questions:
- Are choices that take longer to plan (eg building investment) outperforming things that are easier to change (eg plant and machinery investment).
- Is durable good spending (which tends to occur when households are confident about job/income prospects and so are willing to borrow) falling behind other types of consumer expenditure.
So what is going on here?


Neither of these indicators really scream that we have had an economic cycle - let alone that we are at the peak of one. Spending on durable goods remained low, even though technological advancement ensured that more durable products were available. Furthermore, non-residential building and plant and machinery equipment spending investment have both trended with real terms.
Then again the period of 2002-2009 took the shape of a typical economic cycle and these indicators didn’t - as constant technological change over the last 20 years has reduced the usefulness of durable good and investment measures in judging the economic cycle.
7) Nominal GDP.
For nominal GDP let's grab nominal expenditure GDP, as this most clearly refers to the concept we are interested in when looking at this figure - namely is the monetary value of final economic activity increasing at around the expected rate of 5% pa?

This nominal GDP growth track indicates a monetary economy that is moving along relatively normally with monetary policy set sensibly. The run up in NGDP growth in the last two years could be one of two things - a sign of a surge in demand, which may lead to future issues for monetary policy, or a price shock due to something such as an increase in export prices. So let's have a look at those.
8) Export and import prices.
For all this talk about New Zealand data there is one large channel that can drive the economic cycle in a small open economy that is being missed - trade with the rest of the world. To understand this we need to look at tradable good prices. I’ve grabbed the terms of trade numbers off the RBNZ website (they are also available on the Stats NZ site), and ANZ’s commodity price index to think about these.


What do you know. New Zealand’s terms of trade has been more favourable over the past four years than at any point during the last cycle - the same cycle when dairy prices shot up through the roof.
This is a big deal as it provides a big income boost to the country as a whole.
Furthermore, the ANZ commodity price index shows that a lot of this has been due to rising export good prices, explaining how these positive terms of trade shocks could have pushed up NGDP growth in the prior point.
9) Stock of debt.
Debt is a tricky one. When businesses are confident they are willing to run up debt. When businesses are experiencing weaker demand growth than expected (the idea behind a “late cycle”), they will accidentally run up debt. Both of these are incentives to borrow earlier in the cycle and towards the end, implying that the stock of debt itself should peak late in the cycle.
But this isn’t the only argument. If economic activity is slowing because firms have become unwilling to borrow and invest, then a slowdown in borrowing or even reduction in the stock of debt may be symptomatic of the late cycle. As a result, I don’t really pay much attention to business borrowing in New Zealand for a sign of where the cycle is.
Instead two indicators I find useful for understanding where we are come from household debt and the net . I’ll grab these both off the RBNZ website (series C5 and M7 respectively).


Interest rates in New Zealand have been low - a factor which includes the idea that asset prices have been high (eg house prices) also “stimulating consumer and firm spending”. Furthermore, the reconstruction of Christchurch has been taking place which should also lead to borrowing. But relative to income - and compared to earlier in the 2000s - the stock of household debt has stabilised and NZ’s net international investment liabilities have declined.
Such debt accumulation is consistent with an economy where expectations of future growth have moderated, fitting the observation of lower interest rates. This helps me to understand why interest rates have stayed low - but leaves me still a bit clueless on the cylce.
10) Summing it all up.
What have I learnt in the process of looking at this New Zealand economic information; Mostly that I need to talk to some economists who are up-to-date in asking “why” these things have occurred to figure out what it all means. It is hard to interpret this data without having a view on what potential output is - such as in the analysis performed by the Reserve Bank, which I’ve refused to read until I’ve written this article.
But looking through the data something is quite clear - at face value it doesn’t look like an excessive demand driven economic cycle has been occurring while I’ve stayed away from the data. Instead it looks as if the RBNZ has set interest rates appropriately to achieve inflation and economic outcomes given positive supply shocks - a surprising surge in labour force participation, strong population growth, and a lift in the terms of trade. Furthermore, it appears that in aggregate the income from these supply shocks has been used to reduce New Zealand’s liability position (relative to GDP) to its lowest level since the late 1980s.
I cannot overstate how surprised I am with the increase in labour force participation that has occurred. Given demographics and rising participation among those of retirement age, a participation rate just above 70% was something my modelling has allowed for at the very extreme, but even that was too low. And doesn’t match the expectations of others either.
Employment rates, and participation rates, in New Zealand are high relative to NZ history and relative to most of the world. The increasing entry of new individuals into the labour market has prevented labour cost growth, and so explaining why this has occurred - and why the lift in demand from these new workers has been muted for now - deserves explanation.
I need to know why labour force participation has risen to the degree it has in order to make sense of all of these numbers. So this is what I intend to find out as soon as possible.
4 Comments
I would think the 'casualisation' of work has had an effect on the high labour force participation. I also know quite a few people over 65 / 70 who are still working part time. It keeps them socially connected and provides some income. My dad is 78, he only stopped working half a week at age 75
Not just orchardists will be watching this with interest. Judicial review of MPI Directive begins: https://www.odt.co.nz/rural-life/rural-life-other/judicial-review-mpi-d…
We welcome your comments below. If you are not already registered, please register to comment.
Remember we welcome robust, respectful and insightful debate. We don't welcome abusive or defamatory comments and will de-register those repeatedly making such comments. Our current comment policy is here.