


The dumping of departure cards for people leaving NZ from November 2018 meant Statistics NZ (SNZ) had to find a new way of calculating how many people were leaving the country on a permanent or long-term basis and where they were heading.
It has applied the new approach to the immigration numbers. Lots of thought, time and money will have gone into constructing the new numbers.
Having spent the last two hours working out which of the new immigration series on Infoshare, SNZ's data website, is the right one – a bit of a nightmare - and comparing the new and old immigration and emigration numbers, I conclude SNZ may have botched the job despite good intensions.
The historical immigration data differ depending on which of the new series I downloaded while what looks like the obvious series for immigration and emigration are only updated to June 2017.
More concerning, it looks like the "statistical method" SNZ used for estimating numbers over the last 16 months may be providing grossly inaccurate figures that could in time be hugely revised.
Hopefully over time the methodology is refined and any bugs are ironed out. But for now I warn people to be wary of the migration numbers for the latest 12+ months.
A brief explanation of the new method used by SNZ for the migration numbers
The old migration numbers were based on arrival and departure cards. If someone said they were coming/going for 12 months or more and had lived outside/in NZ over the last 12 months they were classified as an immigrant/emigrant.
This approach has well known shortcomings. As SNZ pointed out with the release of the new numbers this morning, errors can arise due to "circumstances changing, misunderstanding the questions on the traveller cards and incorrectly reporting their intentions, or deciding to extend their visa or stay/absence."
The new numbers are based on assessing info from passport scans (that is, "outcomes"). Someone is defined as an immigrant if they arrive and then remain in NZ for at least 12 of the subsequent 16 months. They are defined as an emigrant if they leave NZ and remain outside the country for at least 12 of the next 16 months. SNZ call this the 12/16 rule.
The problem with this is that someone can't be defined as an immigrant or emigrant with certainty until 16 months after the date of travel.
SNZ uses "a statistical model to produce provisional migration estimates" for that period.
Looking at the new immigration and emigration numbers for last year that were estimated using the statistical model versus the old ones that are based on departure/arrival cards makes a good case for suggesting SNZ's model is an abomination.
Comparing new and old numbers rings warning bells about the statistical model
The chart compares the new and old immigration or arrival and emigration or departure numbers based on annualised and three-month averages of the seasonally adjusted monthly numbers that provide a better indication of what is happening at the margin than the annual numbers. The levels differ significantly but my main concern is the diverging directions last year.
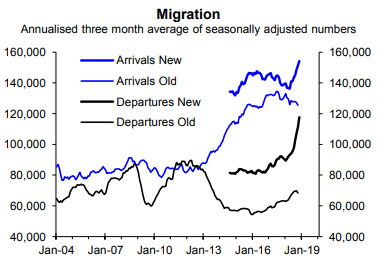
The new numbers suggests lots more people were arriving and departing on a permanent or long-term basis than were stating in the arrival and departure cards. The gap between the new and old numbers makes me a little uneasy about the new numbers. But much more concerning are the estimated large increases in immigration and more so emigration last year versus very different behaviour by the old numbers based on the cards.
Why would the percentages of people filling in the arrival and departure cards incorrectly change so dramatically over the last 12 months for emigration and over the last three years for immigration? Why was immigration nudging lower last year based on departure cards when now we are told it spiked lots based on the statistical model estimates? Why did emigration surge dramatically last year based on the numbers derived from SNZ's statistical model when it didn't increase much based on the cards?
Having spent over 30 years reviewing economic data and data methodology the chart doesn't pass the common-sense test. It rings warning bells about the statistical model used by SNZ.
The chart below shows the gaps between the old and new arrival or immigration and emigration or departures numbers. For emigration before the statistical model starts to have a significant impact last year the gap between the old and new numbers is relatively stable at around 25,000, but as the model had a growing impact over the year the gap grew to almost 43,000. This doesn't look right and to me points to problems with the statistical model. It is a different story for immigration with the number of people inaccurately reporting their intentions having fallen dramatically in 2016 and 2017 while when the statistical model takes over the fall is slightly more than reversed last year.
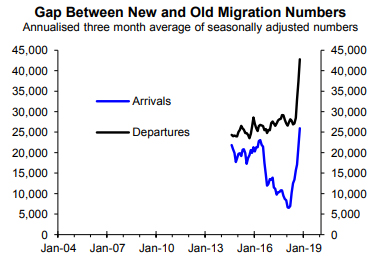
My suspicion is that over the next 16 months as the actuals roll in there will be huge revisions to the estimated numbers. Maybe I'm wrong and for some bizarre reason an increasing percentage of people leaving the country on a permanent or long-term basis last year provided inaccurate indications of their travel plans, while there was a huge fall followed by a major increase in the percentage of people inaccurately filling in arrival cards. But it looks like a reasonably clear case of a statistical model being fed some dubious assumptions.
In terms of net migration the possible misestimates of immigration and emigration partly cancel each other out. But there seems to be more a case for questioning the dramatic spike in the estimated emigration numbers last year than the spike in immigration. It is possible net migration didn't fall as much last year as suggested by the new official figures. Unfortunately, being the "official" numbers doesn't mean you can rely on them as has proved the case at times with the employment numbers, as covered in two earlier Ravings.
How about we have one new series for immigration not several ones that differ
At first glance it looked like a straightforward job downloading the new migration numbers from SNZ's website, Infoshare. The first option was for "Estimated migrant arrivals and departures, 12/16- month rule (Monthly)". This looked like exactly what I was after. But when I downloaded the numbers they were only updated to June 2017 and where they overlapped with the November only monthly numbers in the excel file released by SNZ this morning they differed by around 800 for the last three comparable Novembers and were the same in the subsequent Novembers back to 2008. This was the start of my nightmare of identifying the correct immigration numbers on Infoshare.
Why didn't the first option which is the obvious one to incorporate the correct data have it and why wasn't it up-to-date? It also said it had seasonally adjusted numbers but didn't.
I ended up downloading four series of immigration numbers which looked like they should contain the same numbers: "Estimated migration by direction, 12/16-month rule (Monthly)"; "Estimated migration by direction and country of citizenship, 12/16-month rule (Monthly)"; "Estimated migrant arrivals by visa type, 12/16-month rule (Monthly)"; and the original "Estimated migrant arrivals and departures, 12/16- month rule (Monthly)". The chart below shows the four series of immigration numbers although two of them are almost identical so show up as one on the chart. For some unknown reason they are all the same from August 2017.
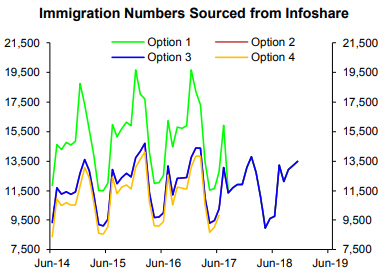
Thankfully the November numbers from one of the series matched the November numbers included in the excel file released this morning. But it took me over an hour to establish this. And while I'm sharpening the burnt stick, I should point out that the excel file SNZ provides at the time of releasing the migration numbers is a pain-in-the-neck. It includes just numbers for the latest month, like the last 11 Novembers, rather than monthly numbers. The file does have monthly seasonally adjusted and trend numbers but just for the last 19 months.
No doubt there is a "good" explanation for why there are different immigration numbers on SNZ's website that have titles that suggests they should be the same. But they should all be the same. Having different ones creates a nightmare for users and raises questions over the thinking going on at SNZ. Maybe the boffins are running wild with little connection to common sense.
15 Comments
"people leaving the country on a permanent or long-term basis last year provided inaccurate indications of their travel plans"
Once here, there might have been a fear of putting down "Leaving Permanently" on departure in case that precluded you from re-entry at some future?
But as you suggest, a longer timeframe for analysis should tell...
Just another case of the statists not knowing WTF is going on. The good news is that we will eventually know - next year some time. In the mean time, my latest stats tell me there are twice as many cars on the road than there were 5 years ago. And alongside that, there are twice the number of deadhead drivers as well.
anyone in Auckland just needs to do a quick ten challenge of their workplace to see the change between NZ born employees to immigrants to see the change and amount brought in to replace leaving kiwis whether overseas or out of Auckland
my own office has gone from 75% kiwis to 40% with no increase in staff numbers
75% left for aussie, 25% left to smaller parts of NZ
and if you look at your extended family its even more dramatic as too who is still in Auckland and who have left and how many went to aussie.
What Stats knows that Rodney doesn't are the census results, which must be showing their previous methodology has overestimated Auckland's population. Stats next revelation might be the underestimate of the retiree exodus from Auckland as per Brian Gaynor's article below. All this explains the worrying inconsistencies in the former Auckland housing shortage myth. Like why did listings (supply) suddenly fall into balance with sales (demand) the moment speculators stopped buying, stalling price rises? Like why didn't rents explode along with sales prices as speculators pumped up the bubble? Sydney-sized house price falls, here we come. https://www.nzherald.co.nz/business/news/article.cfm?c_id=3&objectid=12…
The wider and sadder result of this yuge 'revision' is that trust in whatever else Stats NZ does will be further eroded. They have not covered themselves in glory with the 2018 Census (release date sometime later this year,,,), and this just adds to the Ingloriosity. To which we should add, as Eric Crampton points out, the diversion that is Well-being Measurement.
Why not just compare the trend series - Stats publishes them.
It seems odd that you are using (your own calculation) annualised 3 month averages of seasonally detrended estimates which will inherently bias later period estimates with lower forecast accuracy. This is likely the reason for your discrepancy.
The trend series will not produce anything like this and does a much better job of what you are trying (and failing) to achieve here.
"The new numbers are based on assessing info from passport scans (that is, "outcomes"). Someone is defined as an immigrant if they arrive and then remain in NZ for at least 12 of the subsequent 16 months. They are defined as an emigrant if they leave NZ and remain outside the country for at least 12 of the next 16 months. SNZ call this the 12/16 rule."
Doesnt this mean all the figures need to be 12 month old to establish the category they fall into???? All the rest has to be assumptions
what good is old data? I think they've made a galactic size balls up here. It doesn't surprise me though.....
We welcome your comments below. If you are not already registered, please register to comment.
Remember we welcome robust, respectful and insightful debate. We don't welcome abusive or defamatory comments and will de-register those repeatedly making such comments. Our current comment policy is here.