
This week’s Top 5 is from ASB chief economist Nick Tuffley.
As always, we welcome your additions in the comments below or via email to david.chaston@interest.co.nz.
And if you're interested in contributing the occasional Top 10 yourself, contact gareth.vaughan@interest.co.nz.
1. A capital idea?
We are now two weeks from the May 17 deadline for people to submit to the RBNZ about its proposed increase in capital requirements for locally-incorporated banks. Looking from inside a bank, the capital proposals appear to me as the biggest shift in the local banking environment since the 1980s deregulation. And that’s taking the Global Financial Crisis – and its flow-on impact – into account. So it is worth having your say on the issue. As they say, money makes the world go round, and anything that changes the “soundness” and “efficiency” of that process is worthy of consideration.
The RBNZ has made it easy for people to give their views, which can be done online through this link.
2. Weighing up the capital costs vs. the benefits.
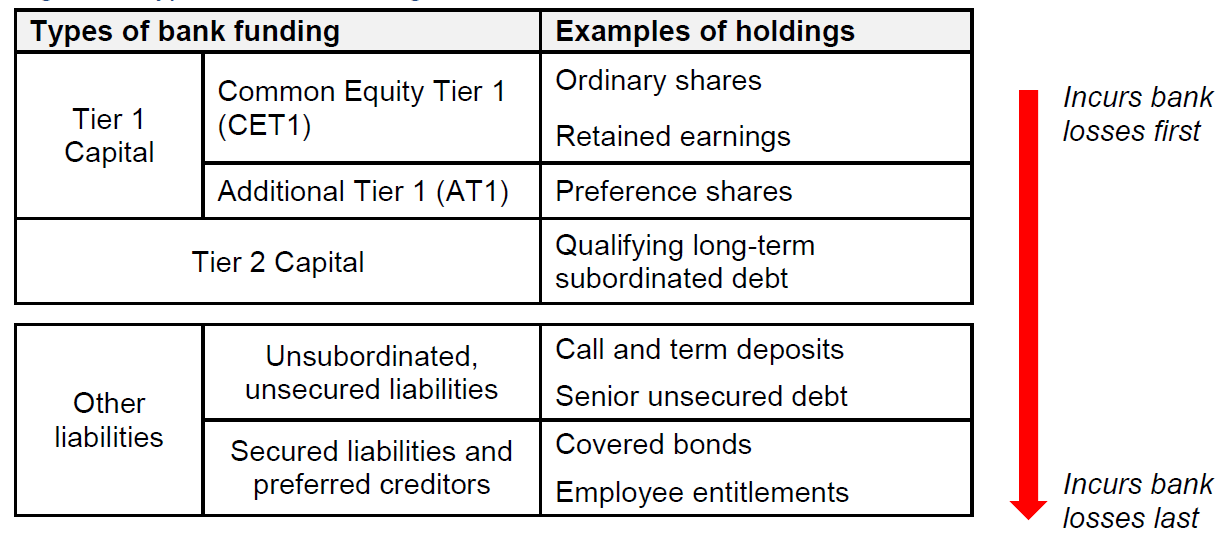
The RBNZ uses an insurance analogy to help explain its rationale for the added capital requirements. The benefit of the added capital is the reduced future harm of a major banking system failure, which can be large. The Global Financial Crisis is a good example of how banking failures can have huge economic impacts: destroying wealth, jobs, and causing economic downturns that can take a long time to fully recover from. In a number of countries, governments had to bail out banks to prevent them from failing, which also resulted in large costs to taxpayers.
Estimating what the benefit of holding more capital could be is, like many things, uncertain. The same goes on the cost side of holding more capital. Nevertheless, my team recently did some extensive work on the potential economic costs of the RBNZ’s capital proposal.
Some key insights we got are that the overall costs are likely to be slightly higher than the RBNZ’s background papers suggest:
- Applying results from overseas economic studies to NZ imply a permanent impact on GDP of up to 1.1%, pointing to some risks to the RBNZ’s 0.2-0.5% of GDP impact.
- Economic impacts, through credit rationing, can be considerable during the transition period to higher capital levels if that period is short.
- The impacts of higher capital are uneven across the economy: borrower types with high regulatory capital requirements tend to be affected to a greater extent.
- The impact on bank customer interest rates is more likely to be in the vicinity of 50-75 basis points than the RBNZ’s estimate of 20-40 basis points.
We didn’t extensively cover the supply of capital in our paper. But the reality of the RBNZ proposal is that one way or another, more capital will have to be held by various bank owners for every dollar lent within NZ. Capital is very mobile within bank divisions, between the finance sector and other sectors, and between countries. The more out of step NZ’s bank capital requirements are from the rest of the world, the bigger the risk this capital is used elsewhere. That might be very good for NZ if it incubated several NZ unicorn companies, but not so good if the capital is put to work somewhere else in the world.
Another potential risk is that the higher capital requirements could tilt the playing field more in favour of unregulated entities that could undermine financial stability within the NZ economy instead of improve it.
The RBNZ has yet to do cost/benefit analysis of its proposal, but will do one for the finalised capital requirements. We do think there are a number of issues on the cost side that need considering when finalising the capital policy, such as:
- The difference the transition period can make to minimising the impact of credit rationing on the economy – the longer the period, the less impact;
- Refining the estimates of the economic and interest rate costs, to have a greater handle on the ongoing economic cost of the insurance being ‘bought’;
- Whether the Tier 1 capital increases could be met to a greater extent from less-costly sources than common equity, thereby keeping NZ more into line with the capital requirements of other banking regulators.
Insurance is an ongoing cost, at the benefit of offsetting the impact of some future probabilistic thing you don’t want to happen. When the economic stakes are high it is important to get the sums as roughly right as possible to ensure we do go forward with the optimum policy setting.
(Image source: ASB)
3. Productivity – and another type of capital.
We are getting close to the release of the first Wellbeing Budget, bringing a focus on the key social outcomes we want to achieve as a country and how to track our progress towards them in a meaningful way. “The Economy”, and the fiscal accounts, have always been about a ‘means’ to an ‘end’ rather than the end itself. The Wellbeing focus makes more explicit the ‘what’ we are aiming to achieve as a society and why.
Still, economists do see the economy as important, much as authors are fond of books. The ‘means’ that an economy provides directly influence the collective quality of life we all have.
Productivity is the long-term key to economic prosperity. But compared to peers such as the US and Australia, our productivity (and, hence, per-capita GDP) is relatively low.
A relatively smaller capital stock is no doubt one of the reasons. With the help of the IMF Investment and Capital Stock Dataset, 2017, we can pull out estimates of the real value of public, private and total capital stock for the US, Australia and NZ for 2015. For example, the real value of NZ’s total capital stock in 2015 was $273 billion in 2011 constant international dollars.
Using the IMF figures, and 2015 population estimates, gives the following per-capita amount of capital in 2015:
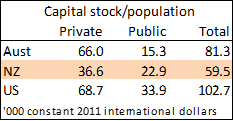
Australia and the US have 80+% more private capital per person than NZ. Even taking into account NZ’s relatively higher public sector capital stock, Australia still has 37% more capital per person and the US 73% more.
Why our standard of living lags behind countries we used to be on par with (or above) will involve many reasons. But the figures above underscore the importance of incentivising to have more of the right capital stock. Capital gains tax has just been taken off the table in NZ. Although a comprehensive tax might have discouraged an overall lift in the capital stock, a residential investment tax might have tweaked the allocation of capital in a way that boosted NZ’s productivity growth.
4. OCR: renewed limbo dance?
Ever since Adrian Orr opened the door a crack to potential OCR cuts in the March OCR Review it seems as if there has been a stampede of shoulder-barging to get through the rate cut door – the ASB Economics team included.
So what’s the rush, when prior to the March Review most economists saw OCR cuts as a risk, not a likelihood? In true economist form, you could write a 100-page treatise on why the OCR should stay where it is and another on why it should be cut. There is obviously no space for that, so here are summaries of both sides of the argument.
In the “if it’s not broken why fix it” camp:
- The global outlook is a little less gloomy than it was around the time of the March statement, with: signs of stabilisation in China; the Brexit can kicked further down the road (possibly even giving time for an actual outcome to be determined!), and; US-China trade talks making progress (slow though it may seem).
- The NZD has eased back since the RBZ expressed concern about it.
- Some domestic business angst should fade, now that the prospect of a capital gains tax has been taken out to the back paddock and quietly buried.
- Some argue that OCR cuts will either have little effect anyway, or take away some of the RBNZ’s ammunition for when cuts are really, really needed.
The “just do it” ledger has:
- Over a period of time the RBNZ ended up substantially overestimating 2018 growth and (relative to its February forecasts) risks doing the same for early 2019 at least;
- Growth tailwinds are not blowing as strong as they used to, and the ‘soft patch’ of 2018 risks extending into 2019 – flagged by the weakness of business confidence surveys. The RBNZ is likely to revise down its growth outlook, on top of the weaker 2018 starting point.
- Core inflation is struggling to lift, and inflation pressures remain contained to isolated pockets.
- The RBNZ’s added capital requirements, though yet to be finalised, will progressively be a headwind to the economy. Admittedly, this is not an issue the RBNZ appears to be putting a lot of policy weight on at present.
One slightly more sobering way to look at it is: if NZ couldn’t generate increased inflation pressure when population growth has been strong, the labour market has steadily tightened, export commodity prices are high, with the tailwind in recent years of above-average global growth – then when will it? What the data are telling us is that we can safety drive the economy faster yet still be within the economy’s sustainable speed limit. After many years of the inflation speed indicator sitting stubbornly in the bottom half of the inflation target band (if not below), let’s just do it.

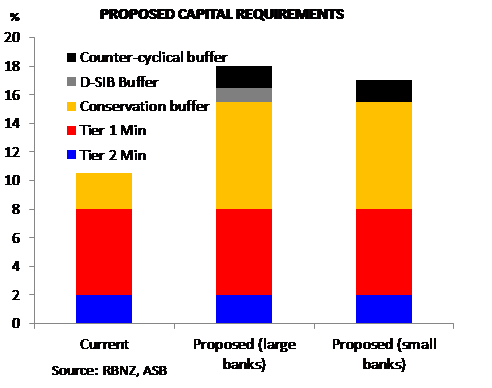
(Image source: RBNZ March MPS)
5. Time, travel – and cost/benefit analysis.
Being a Cantabrian who has temporarily been in Auckland for over 12 years, and an economist, means:
- I can legitimately gripe about Auckland traffic like every other non-Aucklander.
- I see four wheels playing an important role in helping people move efficiently around sprawling cities,
- I know each set of wheels brings its own marginal cost in terms of reducing that efficiency;
- I can observe decisions beyond just the vehicle owner can make marked impacts on the efficiency of the roading system.
Roading decisions made by councils have a huge impact on the usability of the transport system. A current exhibit is Auckland’s waterfront Quay Street (a main arterial route from Eastern suburbs), currently down to one lane each way in the CBD – a move which will eventually become permanent.
As this NZ Herald article notes, commute times along the Quay Street have blown out, with commuters potentially taking an extra hour a week to commute. That’s before even factoring in the impact of traffic from Eastern suburbs diverting and clogging up other arterial routes (such as the Strand) and in turn slowing down other people’s commutes. The future arterial route that Quay St traffic is intended to be diverted down, Customs St, remains partially blocked. The literal gridlock in the early hours of New Year’s Day, when Quay Street was completely blocked in one direction, was comedic.
There is an opportunity cost to all this lost time. AT traffic count data show an average 23,448 vehicles per weekday travelled along Quay St near Plumer St (where the road narrows) in late June 2018, with 6,211 of them in the 3 peak times of the day. Focusing solely on the peak journeys, assuming 1.1 occupants per vehicle[1] (6,832) are affected each week by an hour each, and that each affected person earns $55/hour[2], and you have an opportunity cost in work output or leisure time of $376,000 a week. Add in a generously-low 15 minutes a week for the other 16,361 non-peak time vehicles and you have another $261,000 a week, or around $636,000 a week in total.
It’s been 18 weeks of disruption so far, so potentially $11.5 million in disruption costs. Traffic is not expected to be shifted onto the alternative route for crawling through the CBD until sometime in 2020 – so there will be at least a year of disruption at potentially $33 million a year in cost until then. And that’s before factoring in the potential 50% increase in fuel consumption and carbon emissions from driving that stretch of road, and any impacts in slowing down the commutes of others on alternative roads. Some alternative routes, such as The Strand, take even more vehicles a day.
Presumably, when the final 2-lane road layout is completed and the alternative route is also less of an obstacle course, the impacts on commute times (whether along Quay Street or through broader commuting alternatives) will not be as punishing as they are at present. But there will still be a permanent impact on a large number of commuters: over 20,000 vehicles a day used to use the end of Quay St that will remain permanently narrowed.
Let’s assume half the disruption cost (i.e. $16.5 million a year) persists into the future. The net present value of that cost, at a 5% discount rate, is $322 million. In contrast, the total cost of the “Downtown Programme” waterfront revamp is $321 million. Could the commuting disruption of the project actually cost more than the project itself?
There are obviously benefits/goals intended to be achieved out of this road-related project, as well as the other numerous transport projects underway (raised pedestrian crossings, cycleways, redoing cycleways, lowering speed limits, corridors for buses, light rail, and the central rail loop). But I do wonder the extent to which the costs/negative impacts are being assessed as part of the projects’ consideration.
From an economic perspective, transport and transport projects are about enabling people to get around as efficiently and safely as possible with an increasing weight on environmental outcomes, and finding the optimum societal trade-off between those goals. But if we don’t factor in all the costs – particularly when some of the indirect costs are substantial – we risk making decisions that don’t get the balance right.
One person’s ‘enhancement’ can be another person’s frustration. For many affected people the only realistic travel alternative to make up the lost time may be to buy a DeLorean and turn the commute into a time travel adventure. And on the safety/speed trade-off, in over a century of progress we seem to have gone almost full circle from bowler-hatted men walking in front of cars waving a red flag to safety-hatted people wearing orange vests stepping out in front of cars and pedestrians to corral them.
That’s enough moaning. But I have a lot of time to do it in the mornings these days. It did prompt me to reread Ben Elton’s “Gridlock” (not whilst in the car), in which car companies connived with the UK Government to create gridlock in order to convince the populace that more investment in roads was needed to solve the gridlock – and enable even more cars to fit on the roads. Although that doesn’t quite seem the likely outcome aimed for here!

[1] https://www.tonkintaylor.co.nz/news/2018/4/why-aucklanders-sit-in-their…
[2] The average Auckland household income is $166,000 or $55/hour for a 40-hour week. CBD workers, on average, are likely to have relatively high earnings.
9 Comments
https://www.resilience.org/stories/2019-05-02/scientists-warn-the-un-of…
That's where your 'capitalism' is headed, Nick. These people are starting to say what I've been harpng on about here for years.
Don't worry, though, it's all an externality.......... :)
But is this really anything to do with capitalism? Surely the socialists destroyed their environments way worse?
For instance, China as part of The Big Leap Forward cut down whole hillsides of trees to feed steel furnaces so they could meet arbitrary numbers of tonnes of steel made in a year. The steel wasn't needed, it was just about those at the top crowing about how much the country produced.
Powderdownkiwi. Back in 1962 when Jed Clampett first struck oil it was easy and cheap to extract. (Beverly Hillbilles for all you young whippersnappers). It now takes more energy to extract a barrel until we will get to the point where it will take as much energy to get it out as we extract. Hopefully the opposite is happening with solar. Can you suggest any links to robust analysis of where solar sits? I'm asking as you made a reference to this question a while back. Ta.
Why is Interest.co.nz allowing this naked lobbying/propaganda to be posted here?
The facts are:
- NZ big four banks are exceptionally profitable in international terms
- The NZ owned banks (Kiwibank, Co-Op, TSB) are able to offer comparable rates using standardized models (and all are at or close to new capital requirements).
This is the Big Four just desperately trying to hold onto their outsized profits, that are generated by holding minimal capital, without actually passing on those savings to New Zealanders. And their internal models are not making their lending risk any lower, they just pass that risk on to New Zealand deposit holders (if things go really far south).
I didn't read it that way. Also, he clearly discloses his role and employer, so you can adjust your interpretation for perceived bias accordingly. There have been other contributors arguing for the changes, as it should be. There is already way too much partisan reporting out there, which makes this site a breath of fresh air.
Local Gubmints have close to zero intellectual economic horsepower, and the ponies that do exist seem more Interested in cheerleading, shaking the pom-poms and generally covering the asses of the inept Councils, than they are in doing actual cost-benefit analysis of the type Nick has produced here. We can add to the Costs, the reduction in business prospects, turnover, and value, caused by roadworks outside or upstream of businesses. And good luck with getting Any council to recognise this, let alone Reimburse some fraction of the damage.
We welcome your comments below. If you are not already registered, please register to comment.
Remember we welcome robust, respectful and insightful debate. We don't welcome abusive or defamatory comments and will de-register those repeatedly making such comments. Our current comment policy is here.