

Domestic demand for logs and sawn timber remains strong with many mills operating extra shifts to increase supply. Sawmillers in general are quite optimistic.
CFR sale prices for logs in New Zealand’s main log export destination China increased an average of 8 USD per JASm3 over the last month. However, increased ocean freight costs and the strengthening NZD against the USD meant At Wharf Gate (AWG) log prices received by forest owners only increased by about 4 NZD per JASm3. As China approaches its peak construction season, log demand is increasing and expected to remain strong until the end of the year.
The PF Olsen Log Price Index increased by $2 in September to $116. The index is currently $7 below the two-year average, $9 below the three-year average, and $7 below the five-year average.
Domestic Log Market
Log Supply and Pricing
Mills have reported sufficient log supply and have managed to secure additional supply when they have operated additional shifts. Some mills have reported record production days.
Sawn timber markets
Domestic demand for both industrial and structural sawntimber is strong and well ahead of predictions.
Mills report increased sale prices for sawn timber in Asian markets. These increases were agreed relatively quickly by the buyers which is unusual, so this may be an indication wholesaler in China are preparing for a busy construction season.
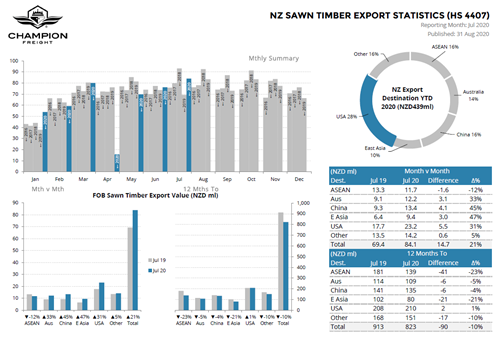
The export destinations for sawn timber are displayed below. Export sales for the 12 months ended July 2020 were 10% down on the 12-month period ended July 2019.
Export Log Market
Log exports by destination are displayed in the chart below provided by Champion Freight.
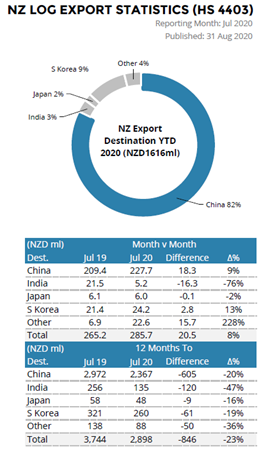
The value of log sales to India has dropped 47% for the year ended July 2020 compared to the year ended July 2019. India was struggling with liquidity and banking issues before Covid-19, but the Covid-19 outbreak in India severely restricted production capacity as well as reducing demand.
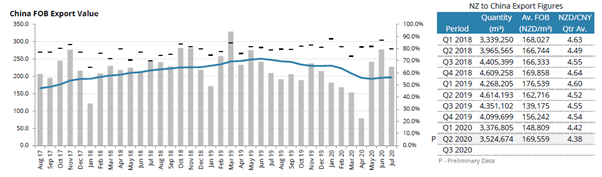
Quarterly log sales to China are shown below. Note the reduced average FOB value in Q1 2020 which lifted again for Q2 2020. New Zealand exported more logs in Q2 than in Q1 despite the lockdown covering one week at the end of Q1 (starting March 25th) then most of April in Q2 (lifting April 27th).
China
The CFR prices have increased for New Zealand pine logs due to increasing demand as China enters the peak construction season. The price for A grade New Zealand pine logs has reached 120 USD which is commonly viewed as the price point where supply from Uruguay becomes viable. The logs from Uruguay are usually sold at a discount of 10 USD per m3 compared to New Zealand radiata logs. The supply of spruce from Europe is likely to slow in the European winter months, but suppliers have benefited from a reduction in transportation costs.
Daily log use in China is now around 80k m3 which is a very healthy increase from an average of 70k m3 last month. For the reasons mentioned below we expect log demand to remain high for the rest of the year.
Log inventory in China is around 4.3m m3, but this may be a misleading figure due to port congestion causing a backlog of vessels waiting to unload.
The price of iron ore has increased by over 40% this year and has reached a six-year high as the Chinese construction and manufacturing sectors experience levels of activity not seen in almost a decade. China imported 100.4mt of iron ore in August which was a 10.9% drop from July, but this was mainly due to port congestion and Covid-19 issues in the supply chain. This was still an increase of 5.4% on the previous year. September is usually a peak for iron steel consumption in China before mill activity starts to decline due to local government restrictions on sintering operations and shaft furnaces to improve air quality in steel producing hubs.
Since the Covid-19 pandemic the Chinese central and local governments has released 683b USD for infrastructure projects.
The CAIXIN manufacturing PMI index rose from 52.8 in July to 53.1 in August. This increase was above expectations as August is usually a relatively slow month for industrial production in China. A PMI above 50 indicates expansion and the August number was the highest since January 2011.
While a strong construction season is expected, the increased supply from South America and the continuing spruce supply, will likely effect price negotiations.
India
There are about three log vessels per month from Uruguay to Kandla comprising about 100,000 JASm3. The CIF in Kandla is at the 120 USD per JASm3 level for A longs (essentially minimum SED 30cm ungraded logs, including some pruned grade).
Sawn timber prices at Gandhidham are at 470 INR per ft3 for sawn timber from Uruguay logs, 480 INR for New Zealand Pine and 490 INR for USA Southern Yellow Pine (SYP). There is still a major issue of labour shortage and mills are currently operating at about 60% capacity.
Exchange rates
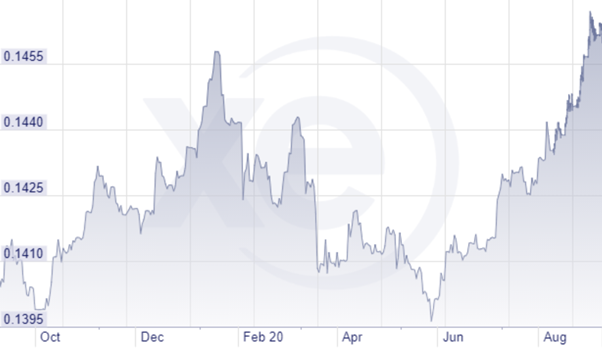
The strengthening NZD against the USD has offset the increases in log sale prices in USD. The NZD was worth 0.6629 USD on the first of August and 0.6760 USD on the first of September. The NZD has recently dropped back into the 0.66 range. Any weakening of the NZD against the USD will assist October AWG pricing.
The CNY strengthening against the USD will increase the buying power of the Chinese log buyers.
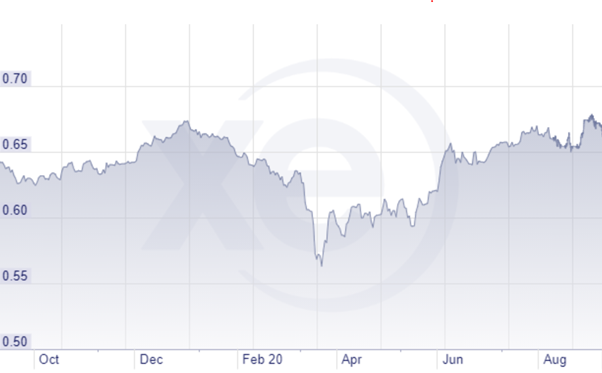
NZD:USD
CNY:USD
Ocean Freight
Ocean freight rates have steadily increased over the last few months as the demand for iron ore and other minerals has increased. As well as the previously mentioned iron ore imports, China imported 666kt of primary copper in August which was a 65% increase year on year. Port congestion in China is across all vessel categories, tankers, breakbulk and containers. Some estimates are that up to 7% of the fleet capacity of Capesize vessels is waiting at ports. The port congestion in China is contributing to a tightening of vessel supply.
This means the ocean freight supply has reduced for log exporters. While there has been a drop in the BDI shown below, the cost for log ocean freight from New Zealand is very much driven by supply and demand.
As China’s demand for iron ore and other commodities abates, we may see more ocean freight supply become available.
The Baltic Dry Index (BDI) is a composite of three sub-indices, each covering a different carrier size: Capesize (40%), Panamax (30%), and Supramax (30%). It displays an index of the daily USD hire rates across 20 ocean shipping routes. Whilst most of the NZ log trade is shipped in handy size vessels, this segment is strongly influenced by the BDI.
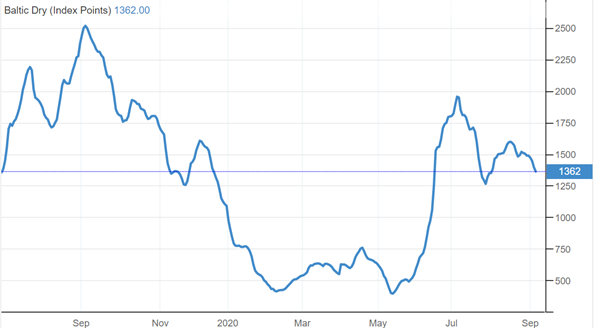
Source: TradingEconomics.com
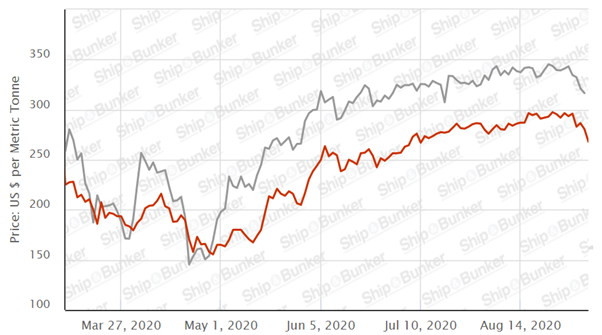
Singapore Bunker Price (IFO380) (red line) versus Brent Oil Price (grey line)
Source: Ship & Bunker
PF Olsen Log Price Index – September 2020
The PF Olsen Log Price Index increased by $2 in September to $116. The index is currently $7 below the two-year average, $9 below the three-year average, and $7 below the five-year average.
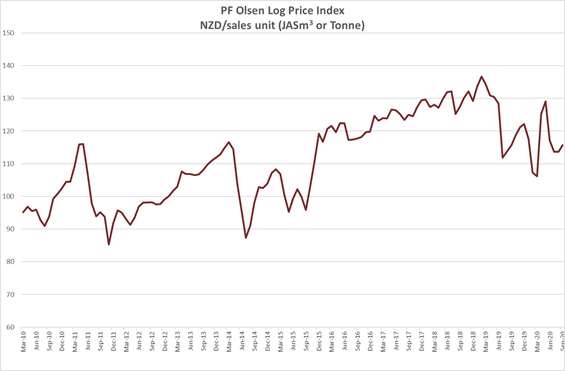
Basis of Index: This Index is based on prices in the table below weighted in proportions that represent a broad average of log grades produced from a typical pruned forest with an approximate mix of 40% domestic and 60% export supply.
Indicative Average Current Log Prices – September 2020
| Log Grade | $/tonne at mill | $/JAS m3 at wharf | ||||||||||
| Sep-20 | Aug-20 | Jul-20 | Jun-20 | May-20 | Mar-20 | Sep-20 | Aug-20 | Jul-20 | Jun-20 | May-20 | Mar-20 | |
| Pruned (P40) | 170-200 | 170-200 | 170-200 | 170-200 | 160-180 | 170-190 | 155-165 | 162 | 162 | 170 | 180-190 | 140-145 |
| Structural (S30) | 110-120 | 110-120 | 110-120 | 110-120 | 110-120 | 115-125 | ||||||
| Structural (S20) | 105 | 105 | 105 | 105 | 105 | 108 | ||||||
| Export A | 123 | 119 | 119 | 125 | 154 | 103 | ||||||
| Export K | 115 | 111 | 110 | 117 | 146 | 95 | ||||||
| Export KI | 106 | 102 | 104 | 111 | 138 | 83 | ||||||
| Export KIS | 97 | 95 | 99 | 105 | 130 | 80 | ||||||
| Pulp | 46 | 46 | 46 | 46 | 46 | 46 | ||||||
Note: Actual prices will vary according to regional supply/demand balances, varying cost structures and grade variation. These prices should be used as a guide only. There was no April 2020 report.
A longer series of these prices is available here.
Log Prices
Select chart tabs
This article is reproduced from PF Olsen's Wood Matters, with permission.


We welcome your comments below. If you are not already registered, please register to comment.
Remember we welcome robust, respectful and insightful debate. We don't welcome abusive or defamatory comments and will de-register those repeatedly making such comments. Our current comment policy is here.