

There was good and bad news for first home buyers in November with housing affordability worsening in some regions and improving in others, according to Interest.co.nz's Home Loan Affordability Report.
Of the 12 regions monitored by the report, affordability for first home buyers improved in six regions and worsened in the other six.
Those regions where affordability improved were Northland, Manawatu/Wanganui, Wellington, Nelson/Marlborough, Otago and Southland, while affordability worsened in Auckland, Waikato/Bay of Plenty, Hawke's Bay, Taranaki and Canterbury/Westland.
The report tracks how much of their weekly after-tax pay a typical working couple aged 24-29 would have to set aside to meet the mortgage payments on homes purchased at the REINZ's lower quartile selling price in each region.
This takes into account the monthly regional movements in house prices and household incomes, and changes in mortgage interest rates.
A feature of the market over the last year has been falling mortgage interest rates, with the average two year fixed rate offered by the major banks (the figure used in the Home Loan Affordability Report's mortgage payment calculations) dropping from 5.98% in November 2014 to 4.81% last month.
Unfortunately the benefit of falling mortgage interest rates has been offset by rising housing prices in many areas, particularly in Auckland where the lower quartile selling price has increased from $548,300 in November last year to $614,700 last month, an increase of $66,400 (12.1%) in 12 months.
That would have pushed the weekly mortgage payments on a lower quartile priced home in Auckland from $750.24 a week in November last year to $757.60 a week last month, as the benefit of lower interest rates was more than wiped out by rising property prices.
Over the same period, the median take home pay for a typical working couple in Auckland aged between 24 and 29 (the income bracket used in the Affordability Report) increased from $1509 a week to $1531 a week, a rise of just $22 (1.5%) a week.
Auckland remains the only region in the country where housing remains seriously unaffordable for first home buyers.
The report says housing is considered affordable when mortgage payments take up no more than 40% of take home pay.
In Auckland the mortgage payments on a lower quartile-priced house would take up 49.5% of a typical first home buying couple's take home pay, and that's before allowing for other property related expenses such as rates, insurance and maintenance.
Housing has only become unaffordable for first home buyers in Auckland since July 2013, when the mortgage payments on a lower quartile priced home would have taken up 38.73% of a typical first home buying couple's take home pay.
Since then the lower quartile selling price in Auckland has jumped form $444,000 to $614,700 (up 38.5%), pushing weekly mortgage payments up from $576.62 a week to $757.60 (up 31.4%).
Over the same period the median take home pay for a first home buying couple has increased from $1489 a week to $1531 a week, a rise of just 2.8%.
After Auckland the next most expensive region for first home buyers in November was Central Otago Lakes where the mortgage payments on a lower quartile-priced home would have taken up 28.2% of a typical first home buying couple's pay, which was well within the affordable limit.
In Wellington the mortgage payments on a lower quartile-priced home would take up 25.6% of a typical first home buying couple's take home pay and in Canterbury it would be 27.9% .
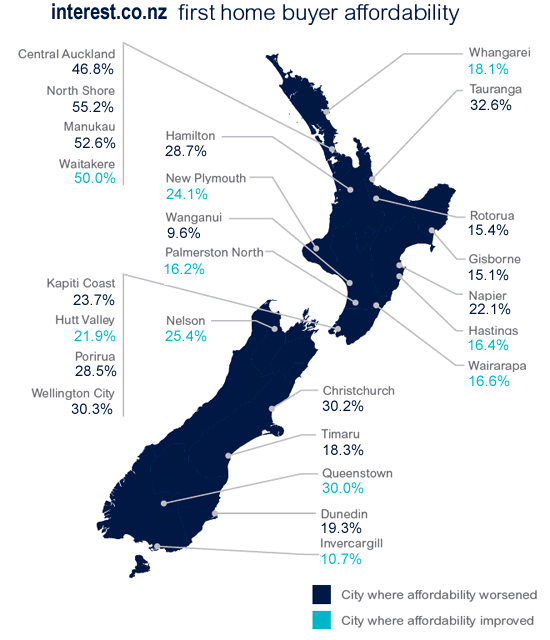
See the charts below to compare the affordability figures for all regions:
Interest.co.nz Home Loan Affordability ReportFor Typical First Home BuyersNovember 2015 |
||||
|
|
REINZ Lower Quartile Selling Price | Weekly Mortgage Payments | Median Weekly Net Income | Mortgage Payments as % of Net Income |
| Northland | $265,700 | $295.84 | $1415 | 20.9% |
| Auckland | $614,700 | $757.60 | $1531 | 49.5% |
| Waikato/BoP | $305,500 | $348.50 | $1423 | 24.5% |
| Hawke's Bay | $218,300 | $233.13 | $1353 | 17.2% |
| Manawatu/Whanganui | $175,900 | $186.19 | $1437 | 13.0% |
| Taranaki | $232,400 | $251.79 | $1437 | 17.5% |
| Wellington | $345,800 | $401.82 | $1567 | 25.6% |
| Nelson/Marlborough | $306,400 | $349.69 | $1424 | 24.6% |
| Canterbury/Westland | $362,300 | $423.65 | $1517 | 27.9% |
| Central Otago/Lakes | $342,700 | $397.72 | $1410 | 28.2% |
| Otago | $214,100 | $227.57 | $1410 | 16.1% |
| Southland | $140,400 | $148.61 | $1438 | 10.3% |
| All NZ | $304,750 | $347.51 | $1497 | 23.2% |
*Home Loan Affordability Report methodology:
The interest.co.nz Home Loan Affordability Report calculates the mortgage payments on homes if they were purchased at the REINZ's lower quartile selling price in each region, and then calculates how much of a typical first home buying couple's income the mortgage payments would consume.
The mortgage payments are based on a 25 year mortgage at the average of the major banks' interest rates for a two year fixed rate loan, while typical first home buyers' after tax incomes in each region are based on the regional median incomes for couples where both are aged 25-29, which are taken from Statistics NZ's Linked Employer-Employee Data Survey.
The deposits needed to buy a lower quartile-priced house in each region are calculated as the lesser of 20% of the purchase price, or the amount that would be accumulated if the couple saved 20% of their net income for four years, and earned interest at the average 90 day bank deposit rate.
We welcome your comments below. If you are not already registered, please register to comment
Remember we welcome robust, respectful and insightful debate. We don't welcome abusive or defamatory comments and will de-register those repeatedly making such comments. Our current comment policy is here.