

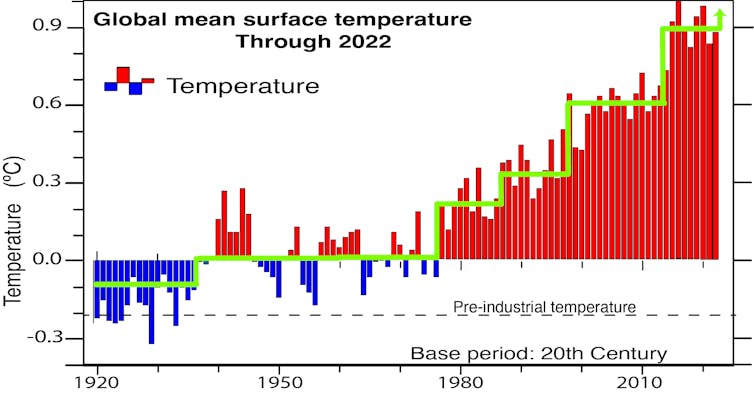
Global warming took off in the mid-1970s when the rise in global mean surface temperature exceeded natural variability. Every decade after the 1960s has been warmer than the one before and the 2010s were the warmest on record. But there can be a lot of variability from one year to the next.
Now, in 2023, all kinds of records are being broken. The highest daily temperatures ever recorded globally occurred in early July, alongside the largest sea surface temperature anomaly ever.

June had its highest global mean surface temperature, according to preliminary analysis. The extent of Antarctica’s sea ice has been at a record low. Meanwhile, atmospheric carbon dioxide concentrations continue to increase at rates that show no sign of slowing.
Evident consequences include torrential downpours in some parts of the world which contrast with excessive heatwaves and wildfires in other locations, notably recently in Canada.
But global mean surface temperature does not continue relentlessly upwards. The biggest increases, and warmest years, tend to happen in the latter stages of an El Niño event.
Human-induced climate change is relentless and largely predictable. But at any time, and especially locally, it can be masked by weather events and natural variability on interannual (El Niño) or decadal time scales.
The combination of decadal variability and the warming trend from rising greenhouse gas emissions makes the temperature record look more like a rising staircase, rather than a steady climb.
Sources of variability
Atmospheric carbon dioxide concentrations continue to climb relentlessly upwards despite the Paris Agreement and the many countries and organisations (cities, companies) that have made good on their commitments to cut emissions.
Unfortunately for the planet, some nations, including China and India, have continued to burn coal and install coal-fired power stations whose emissions more than offset gains elsewhere.
But the rise in temperature follows a step-like progression. The warmest year in the 20th century was 1998, following the 1997-98 major El Niño. Then the warming paused and the so-called “hiatus” in global warming from 2001 to 2014 led climate change deniers to become vociferous in proclaiming global warming was a myth.
The major El Niño event in 2015-16 changed that. 2015 became the warmest year on record, ending the hiatus, only to be surpassed by 2016, which remains the warmest calendar year so far in many records.
A lot of year-to-year variability is associated with El Niño events. But it is more than that. Further analysis reveals that the Pacific decadal variability, sometimes referred to as the Pacific Decadal Oscillation or Inter-decadal Pacific Oscillation, resulted in changes in the amount of heat sequestered at various ocean depths.
The Pacific Decadal Oscillation may be thought of as a northern-hemisphere version of the Inter-decadal Pacific Oscillation.
With the Pacific Decadal Oscillation, there were major changes in Pacific trade winds, sea-level pressure, sea level, rainfall and storm locations throughout the Pacific and Pacific-rim countries. These changes extended into the southern oceans and across the Arctic into the Atlantic.
The effects are greatest in winter in each hemisphere. There is good but incomplete evidence that changes in winds alter ocean currents, ocean convection and overturning, resulting in changes in the amount of heat sequestered deep in the ocean during the negative phase of the Pacific Decadal Oscillation.
Accordingly, during the positive phase of the Pacific Decadal Oscillation, more heat is deposited in the upper 300m of the ocean, where it can influence global temperatures. During the negative phase, more heat is dumped below 300m, contributing to the overall warming of the oceans but lost to the surface.
During El Niño, heat stored at depth in the western tropical Pacific is moved around and returns to the atmosphere, providing a mini global warming.
Temperatures rising
Research shows that ocean heat content increases more steadily than surface air warming and is a better metric to show that global warming continues.
Sea-level rise comes from both the expansion of the ocean as it warms and the melting of land-based ice (glaciers and ice sheets in Greenland and Antarctica). This puts more water into the oceans. Fluctuations occur as rainfall is partitioned differently between land and the ocean, with more rain on land during La Niña events.
The ocean covers 70% of the Earth. Because most of it is in the southern hemisphere, which experiences winter in June to August, the highest values for sea-surface temperatures occur in March, at the end of southern summer. But as land temperature variations are much larger, the highest global mean surface temperatures occur about July.
With a new El Niño emerging and prospects that it could be another major event, are we about to experience the next step up the stairs? Already in 2023, sea-surface temperatures emerged in April as the highest on record and values are running 0.2℃ above previous highs.
This set the stage for June to have record high surface air temperatures globally. In early July, they hit the highest values on record.
🌏 Why are so many climate records breaking all at once?
— The Conversation (@ConversationEDU) July 6, 2023
From the hottest global average day, to the highest average sea surface temperature and the lowest Antarctic sea ice extent – @MonashUni's @kjreid95 explains: https://t.co/u8prkvgQkP
We can expect 2023 to emerge as the warmest year to date. But sea-surface temperatures during El Niño events tend to peak about December and have the greatest influences in the subsequent two months. That sets the stage for 2024 jumping up the staircase to the next level, perhaps to 1.4℃ above pre-industrial levels, with likely daily incursions over 1.5℃.
Once the next La Niña event comes along, there’ll again be a pause in the rise, but values will never quite go back to previous levels.![]()
*Kevin Trenberth, Distinguished Scholar, NCAR; Affiliate Faculty, University of Auckland. This article is republished from The Conversation under a Creative Commons license. Read the original article.
38 Comments
Sounds kind of stupid I know, but if it would at least stop raining every 5 minutes I would be happy. Crickey even the concrete doesn't have time to get dry. Still shouldn't complain next minute its no rain for months.....
Good solid science - unlike the c--p some refer to (profile means side-on, doesn't it?)
From a big-picture Limits to Growth perspective, though, I'd mildly pull him up - and this goes back to silo-ing; India and China are servicing OUR demand for cheap goods. It's us, to blame for that, to a large extent.
But more generally, without fossil energy we aren't living at anywhere near this level. Time we got used to that.
so hotter world will be more coal fired power stations in India and China as more aircon is turned on - and probably more nuclear in other countries. Not really adding to a solution
And you may be right about us buying China's cheap good but regardless they will still push their material living stds up so increasing energy use
Here in NZ we still dont seem to be doing much to adapt to climate change so expect more hand wringing from leaders when the next disaster strikes
Guess to "do much" would require the goal posts to stop moving? The first step in getting us out of the hole, is to stop digging. Instead our esteemed politicians are working hard at shoveling faster, and we keep voting for it.
Indeed. Just look at the boost National are getting from, yet again, saying they will delay farmings entry into the ETS cos its just not the right time (and never will be, classic can kicking).
It doesn't matter what NZ does to "stop digging" because practically every other country in the world is still digging as part of this global consumption-obsessed economy.
It matters to not be part of the insanity.
I think you're just upset with profile because he provides actual data that blows your narrative to shreds.
Like the unmanipulated satellite data, which shows a linear warming trend of 0.13 degrees per decade since 1979. This warming is attributable to the natural Mikankovich cycle and nothing to do with man made global warming.
Or the fact that the panic inducing models are inconsistent with the above-mentioned empirical data.
We just had three La Niña's in a row, and this year is El Niño. So what?
fat pat,
Heartland? If you are quoting them as an authority, then you really are scraping the bottom of the barrel. Just go back and look at their involvement in denying that tobacco was harmful.
I would love to know just how you equate the Miankovich cycles; cycles over some 19,000 to 23,000(precession), 43,000(tilt/obliquity) and 100,000(eccentricity) years with the changes taking place over just the last few decades.
I still find myself surprised by the lengths deniers will go to, to 'explain' away what is increasingly evident and actually, very simple to understand in terms of the basics.
Denial is a cult. A death cult.
I remember about 15 years ago I first noticed the denial movement in local media. Back then it was a battle of what was known and what wasn't. Cosmic rays, changing cloud cover, a pause that wasn't, Lindzens lens theory etc, etc. I used to do time consuming research and reply to all the whatboutisms with what the latest science had uncovered. Way too much time. It made no difference to the anti climate reality noise machine because it's never been about facts. It's about maintaining a certain philosophical stance that ensures privilege for the entitled few. The noise has changed form and now consists of mainly " the climate has always changed" .
If anything the situation has got worse, with inactivism the new denial. Along with organisations such as the IPCC rotting with pro polluters.
https://www.euronews.com/green/2022/11/10/fossil-fuel-lobbyists-outnumb…
I'm sure some believe the nonsense they spew, and if it was harmless, rather than existential, I wouldn't give two hoots. Problem is the future of 8 billion humans is on the line. The time for polite tolerance of this dangerous denial cult is long past.
0.13 degrees Celsius per decade is consistent, as far as I can tell, with the earth's natural temperature gradients wrt time. Temp gradients look steeper during the transition from the medieval warm period 1200 AD to the little ice age 1600 AD. You're also making a logical fallacy by trying to discredit information based on the source rather than addressing the topic directly.
Scientists involved in analysis of satellite climate data say surface temperature measurement is more accurate.
https://m.youtube.com/watch?v=8BnkI5vqr_0&t=3s&pp=ygUaQ2FybCBtZWFycyBzY…
Gee, haven't you got something more up to date than fake controversies from over a decade ago? There's been substantial global heating since then.
Mmm, toasty.
https://phys.org/news/2023-07-florida-hot-ocean-temperatures-humidity.h…
Now let's have a piece on the mechanisms by which climate change will progressively damage the global (and NZ) economy.
Surely there is at least one economist in NZ who can write an article on this........(as an advancement to the countless 'we believe the OCR is now on hold' puff pieces which is all they seem to be able to churn out).
Face slap. The economy will be what physics allows it to be! Yes, we will either act on climate and be able to survive, or we won't act and surviving economists will be huddled on a dinghy like the rest of us. If we do act, there will be an economy of some sort, if we don't act, the only economy will be the price of spit roasted rat.
I'd be wary of anything Trenberth produces on climate change. "Trenberth has a lot of faith in his models – so much so, a few years ago (my estimate around 2013) he demanded that the “null hypothesis” be reversed. "
He has also been involved in a court case in Montana USA where his interpretations of another climate scientist were rebutted, but not used in evidence. Somewhat of a circus in my view.
"The Plaintiffs solicited 6 rebuttal reports from their witnesses in an attempt challenge my Report, they even dredged up Kevin Trenberth as a rebuttal witness in attempt to take me down. "
https://wattsupwiththat.com/2023/06/22/held-v-montana-climate-lawsuit/
I take it you don't like the message then? Trenberth seems to have the same take on anthropogenic global heating as the rest of the science community. Unlike the wacko web site run by flat earther Watts, which has got every anti science "prediction" he promoted over the last 15 years wrong!
Its hilarious denial site Watts running a celebratory opinion piece when the case has not yet been resolved, but that's how deniers work isn't it? A lie can travel around the world before the truth gets it's pants on.
https://www.theguardian.com/us-news/2023/jun/20/held-v-montana-climate-…
Around 1978-1979 we were being told a mini ice age was coming, the last one lasted 500 and ended around the time of Napoleons invasion of Russia which hundreds of thousands of his army died from the freezing cold weather. When you look at satellite photos we can see where rivers were once running through now desert areas.
In the '70s evidence of human heating hadn't been resolved from natural variability. Now it has. What's your point?
The world heats and cools over hundreds of years we will just need to adapt the point is the next mini ice age could turn up in the next 60 years. Palmtree08 you seem to be overheating try opening the fridge door and cool down.
There is a special place waiting for idiots that refuse to accept the difference between natural climate changes and human caused rapid global heating.. Of course nuclear winter, asteroid strike or a shutdown of the AMOC would freeze the planet,or parts of it, but failing that, the next ice age has been cancelled.
https://theconversation.com/climate-explained-why-we-wont-be-heading-in…
Its the speed of change that is the problem. Given time nature and weather patterns will adapt in a orderly fashion , no real problem.
We have mosquitoes and midges in July.currently our minimum temperature is 5 degrees above the normal lowest temp. we normally have a -1 or -2 spate of frosts to kill the bugs , rodents , and diseases off. calf rearing season is going to be a shitfest (literally)of disease.Will some fruit trees set fruit , who knows.
invest in rat trap and insect spray , you'll make a fortune
I like Mango, I am hoping to grow them.....
Why not shift to Fiji then, rather than cause global mass extinction by shifting our planets energy balance, just so you can grow mangoes?
Get a grip! How the f##k can you be so sure and don’t say the science is settled!
Maybe look around the natural world around you...see any changes occurring??
It’s called the weather, and the seasons. Flooding has occurred since the beginning of time. This can be shown by reading history, and not the made up kind that is being pushed today. Also, remember that the media are pushing a constant stream of weather reporting, so you may think the weather has changed but maybe it’s because you are aware of it.
Get a grip? Anyone with a basic understanding of science can see where this is going. Personally I don't have this weird cult like human exceptionalism filter to view existence through. The universe is a cold hard place and it will spit out humans and all the religious and economic narrative nonsense created in an instant, if the physics that allow us to exist in this time and place are ignored.
The only grip science deniers have is to fairytales of an evil cabal of scientists in cahoots with global government that want to take your money and install communist doctrine. It's not me that needs to get a grip!
Bollocks. This number was plucked from the University of Maine’s Climate Reanalyzer. Which is based on satellite temperature data. Along with guesstimates of historical temperatures. That's right, guesstimates. The whole thing is just another made up load of drivel that helps climate alarmists build on their narrative. And what margin of error do the weather stations used by UoM's Reanalyzer have? I have read a couple of studies, (try these for starters: Corrupted Climate Stations: The Official U.S. Surface Temperature Record Remains Fatally Flawed - Heartland Institute 2022, which was a follow up to Is the U.S. Temperature Record Reliable - 2009) which show the margin of error is 2 degrees. And the increase we are seeing is around 1 degree. Therefore, laughably, the margin of error exceeds the supposed increase.
Heartland? Weren't they the corporate lobbyists that managed to delay health warnings about smoking? This time it's not just smokers having their lungs eaten by cancer, all life on planet Earth is at risk because of those Heartland scumbags.
In my lifetime we've been threatened with oil running out, ice age in 10 years, the ozone layer disappearing, the ice caps melting, and acid rain.
I'm sceptical...to say the least.
You have a cranial logic-capacity problem.
Oil is indeed running out. Peak conventional (LSC) was about 2005/6. Peak all-liquids is looking like 2018. It's a finite resource, our use has been exponentially increasing. only one place that goes,,,
You are still alive, yes? Have been since you were born, I suspect. I also suspect you won't be alive 100 years from now. Does your being alive now, say that last posit is wrong?
See?
If oil wasn't running out, why would humans be exploiting tar sands goo, hydrofracking shale rock, drilling deep water, calling biofuel "oil" etc?
Ozone disappearing? Heard of the Montreal protocol?
https://www.unep.org/ozonaction/who-we-are/about-montreal-protocol
Acid rain? Heard about smoke stack scrubbers?
https://en.m.wikipedia.org/wiki/Flue-gas_desulfurization
Both from a time when science was taken more seriously and before the ignorant flooded the internet.
Ice caps melting? Well they are.
https://climate.nasa.gov/vital-signs/ice-sheets/#:~:text=Antarctica%20i….
'70s Ice Age predictions? Well concern was justified due to uncertainty about whether human caused global dimming, or human caused global warming would dominate? As it turned out smoke stacks were cleaned up and CO2 continued to be dumped into the atmosphere.
https://en.m.wikipedia.org/wiki/Global_dimming
You should be sceptical about the crooks flogging climate denial, not those trying to clean up their filthy habits!
We welcome your comments below. If you are not already registered, please register to comment
Remember we welcome robust, respectful and insightful debate. We don't welcome abusive or defamatory comments and will de-register those repeatedly making such comments. Our current comment policy is here.