Summer chart series: The divergence between bank lending and house sales

24th Dec 09, 9:01am
by
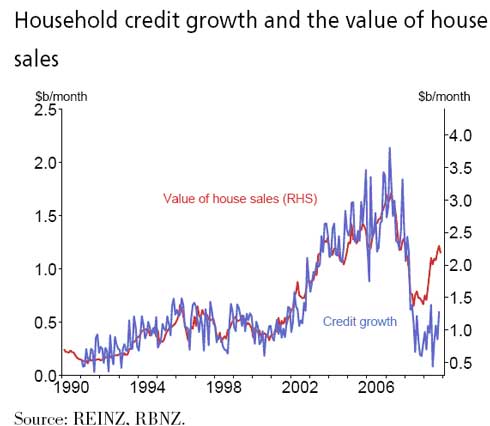
Bernard Hickey picks out 10 charts from 2009 in a series of videos to play over the Summer break. In this video he looks at how a once close connection between the value of houses sold in any one month and bank lending in that same month has diverged through 2008 and 2009.
Banks are more reluctant to lend heavily on housing and credit growth has slowed to around 3% a year from over 15% at points in the housing boom from 2002 to 2007. Despite a pickup in activity and values in the housing market, bank lending has not returned to its previous track, which explains why the recovery in house prices through mid 2009 appeared to run out of steam at the end of 2009.
We welcome your comments below. If you are not already registered, please register to comment
Remember we welcome robust, respectful and insightful debate. We don't welcome abusive or defamatory comments and will de-register those repeatedly making such comments. Our current comment policy is here.