

Today's Top 10 is a guest post from Matt Nolan.
As always, we welcome your additions in the comment stream below or via email to david.chaston@interest.co.nz.
And if you're interested in contributing the occasional Top 10 yourself, contact gareth.vaughan@interest.co.nz.
See all previous Top 10s here.
Earlier this month, labour market information was released by Statistics New Zealand. Understandably the focus was on the lift in the unemployment rate in the quarter.
Although quarter-to-quarter movements give us some information, we can gain a wider understanding of the New Zealand labour market by looking at the data in a longer term perspective.
Here we’ll have a look through ten of the ways we can chop up and consider our labour market data.

1. The unemployment rate.
The number that gets the most attention following the release of the Household Labour Force Survey (HLFS) is the unemployment rate. This tells us the proportion of the labour force (those aged over 15 who are current available and willing to work or working) that are not able to find work.
Due to the fact that it takes time for potential employees and employers to find each other and match their interests there will always be some unemployment. However, the higher this figure creeps up the more concerning it is – whether it be for structural reasons (eg a mismatch of skills and employer requirements) or cyclical reasons (a temporary drop off in the demand for goods and services).
Un/underemployment as a percentage of the labour force, annual average

Another figure I’ve popped up here is the underemployment rate. This figure is made up of individuals who are currently working part-time but would like to be working more. Another interesting metric would be an over employment rate – those reporting they would be willing to work less for lower gross pay – but the combination of unemployment and underemployment provides an interesting perspective on the periods when it has been the most difficult to find work.
2. Unemployment duration.
As mentioned above, unemployment will always exist as it takes time for employers and employees to find each other. If this process does not take long then unemployment is not too big a deal. When it does become problematic for the individuals and families involved is when people are unemployed for a significant period of time.
The HLFS also provides figures on the duration of those who are unemployed.
Length of unemployment as a percentage of the labour force, annual average
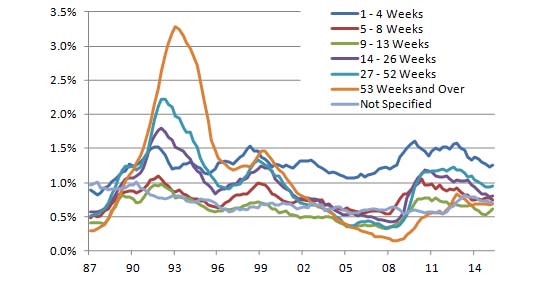
Part of the reason why the recession of the early 1990s was so much worse than the recent recession for many individuals was due to the large numbers that were out of work for a long period – as shown by the sharp increase in the 14-26, 27-52, and 53+ week lines.
Interestingly, the 1-4 week line stays roughly between 1% and 1.5% of the labour force all throughout the history of the series – something you would expect given that some unemployment is due to people shifting between jobs, and the constant process of job destruction and creation that occurs.
3. Youth not in employment, education, or training.
At different stages of our lives unemployment means different things. When we are young we may use unemployment as a reason to go and take on educational challenges so we can build up our skills, when we are in our twilight years we may use it as a sign that it is time to retire, and when we are in our prime earning years with a family the loss of employment and related income is something that is very costly.
Given this perspective it doesn’t always make much sense to talk about “youth unemployment” – as the labour force will look especially small given the exclusion of individuals in training. Instead it is interesting to consider what proportion of young people aren’t trying to build up their human capital by working, training, or taking educational courses. The statistic that represents this is called Youth NEET (not in employment, education, or training).
NEET rate for youth age groups
As a side note, some people hate the term human capital – they find it a demeaning way to use the terms we would use about a machine when discussing another human being. But I completely disagree. If we are talking about a labour market and people’s choice to invest in their future they are building skills as a form of “capital” – like all capital it is an investment in the person’s future. It would be a mistake to think that all that matters about a person is their human capital or productive capacity – but that has nothing to do with the words human capital, and everything to do with some people’s refusal to respect the innate value of other people.
What do I mean by all of this? Well investing in human capital when you are young is a choice regarding your income and consumption possibilities in the future. If a young person decides they want to spend their scarce time doing other things this may or may not be a good choice – we need to be careful before we decide a lower NEET rate is a good thing.
In other words, although a lower unemployment rate is an unambiguous good (as the person has said they want to work) we need to be more careful with the NEET rate.
4. Employment rates and participation.
All this talk of unemployment rates only tells us part of the story. As we noted when discussing the labour force participation rate we were talking about people who were available and willing to work. However, the proportion of the working age population (those aged over 15) who are available and willing to work changes over time due to a number of reasons: discouraged workers, changes in the age make-up of the working age population, changes in social attitudes and pressures towards finding work.
In this context we have two other statistics – the employment rate (the proportion of the working age population who are employed) and the participation rate (the proportion of the working age population who are in the labour force eg that are available and willing to work).
Percent of working age population, annual average
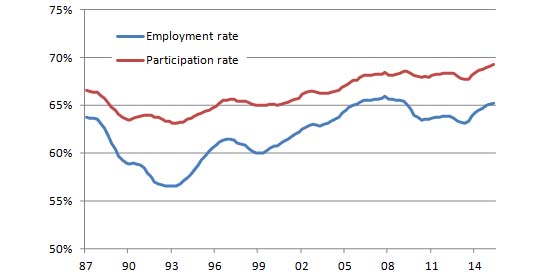
This graph gives a whole new perspective on what is going on in the labour market! There is a record proportion of the population (aged over 15) that wants to work, and a historically high proportion of the population is in work. However, so many people want to work that the unemployment rate remains high.
Such high employment and participation, in the face of still elevated unemployment, is a very interesting phenomenon. Before we could say whether it is good or bad we need to know, why are people so willing to work?
5. Participation among the sexes.
Now that we’ve covered a bunch of the overall figures, we can dig into trends among some of the different groups we may be interested in. One interesting area where the labour market has changed considerably is with regards to gender.
Participation rate by sex, annual average
Since the data began in 1986 there has been a steep lift in female labour force participation. Increasing participation by sole parents (who are largely female) and by both partners in couples (where the female partner would in the past have often dropped out of the labour market) are both factors behind this.
With this trend of a closing gap between male and female labour force participation petering out in some other nations (eg the United States) there is a question regarding how much longer this will continue.
6. Participation of older workers.
We discussed young people in the labour market earlier on. However, there have also been interesting changes in the labour force status of older workers.
Participation rate by age group
The labour force participation of those aged over 55 has risen considerably over the past 30 years. Although this is in part due to the gradual increase in the retirement age from 60 to 65 during the 1990s, participation rates continued to climb over the 2000s.
Together, the increase in female labour force participation and the increase in participation by older workers goes quite a way to explaining the lift in overall labour force participation over the past 30 years.
7. Industry shares.
Free trade, globalisation, burgeoning demand for services, and the rise of robots have all been factors that have changed the shape and nature of the industries that people will find gainful employment in. This is part of the reason why the HLFS data for industry employment only goes back to 2003 – as the constant change in the type of industries in the economy forced Statistics New Zealand to change the way they classified industries.
Using a rough split into primary, secondary, and tertiary industries we get the following changes in employment shares by industry:


One important fact to note is that I’ve attributed industry employment in a number to business service industries to the tertiary sector – if we see them as an input to final production this makes this categorisation a little different to the traditional way of viewing these industries. As employment shares did not change significantly in many of these industries this isn’t too important.
Since 2004 we have seen the share of employment in agriculture, manufacturing, and wholesaling pull back. Furthermore, the share of total employment that is in the retail sector has also declined – as online shopping and increasing automation reduce the need for staff. The big increases have been largely in services – with Health Care and Professional, Scientific, Technical, Administrative and Support Services all seeing disproportionately large increases in employment. Construction employment is also elevated, however there is a debate regarding how much of this is rebuild related.
8. Occupation shares.
However, industry employment only tells us part of the story. Although office work remains a massive employer now, as it was in the 1950s, the occupation of typist has virtually disappeared due to the rise of the personal computer.
Although people do have some industry specific skills, most of the skills we develop over our lifetime are related to an occupation – as a result, it is the change in occupations that is arguably more important when it comes to considering what is happening in the labour market.

This data suggests that there has been a disproportionate lift in “professionals”. What these categories represent can be found here. Professional is a gigantic category, including accountants and economists but also including actors and librarians. The key thing all the professions require is some form of tertiary education – essentially the growth in employment in this area mirrors the growing tertiary education sector.
9. Occupation sought by those out of work.
While we are on the note of occupation, Statistics New Zealand now collects the “occupation sought” by those out of work. Given that unemployment is in a large part a matching problem between employers and potential employees, understanding which groups are having the most trouble finding work helps us to understand the nature of this problem.

To interpret these figures we have to look at them with reference to how large their share of employment is (from graph 8) and with reference to how large the residual category is (unstated or unsure). However, at 16.4% sales workers share of unemployment is disproportionately high.
In this context, the number of people looking for professional work appears to be quite small – indicating that the matching problem is not acute in this area.
10. Regional participation.
Understandably, we don’t just care about national results – we are also interested in how different regions are faring. However, a word of warning when looking at these figures – these surveys are not designed to analyse regional trends, and so we have to be careful not to overstate the strength of the results we pull from this data.
As a result, I will provide a graph of the participation rates by region through time without comment.
Participation rates by region

-----------------------------------
* Matt Nolan is an economist at Infometrics, and an author at the blog TVHE. He specialises in looking at the household sector, and household economic data, but will offer an opinion on pretty much anything related to business and the social sciences.
9 Comments
I wonder if the older participation is driven by the gradual deterioration of spnding power and people be driven to work longer by the need to have income rather than having enough in the pension. remeber that many of these will be Baby Boomers who will have believed that they had a contract with the Government that a portion of their taxes were put aside to come back in their retirement. Piggy squandered that and it took Labour and Michael Cullen to reinstate some kind of plan that we now know as Kiwi saver.
That and modern live-to-work mentality. More people are reaching retirement age and finding they have a lot of life left but nothing in common and nothing to do with themselves but hang about with old folk feeling useless - many social groups are designed around young people or earning people. A few groups like Probus are still doing well ... too well... they have waiting lists over a year long. But that demographic aren't viable as a commercial target.
You can't just work of the Unemployment number. That is filtered such that people must be ready and available for _any_ kind of work.
To reduce the paper numbers in the last 10-15 years for government reports people with any kind of difficulty/barrier to employment have been moved off that list on to DPB (limit hours of availability), Sickness (limited hours/physical capability), Invalids (severe limit on hours/capability), or Work-schemes (temporarily not available for full time contracts), Assisted Training programs (not actual students, but not required/available for full time contracts).
Great article Matt.
Would also love to see those over-employment figures, as I'd love a part-time/job-share position but the only ones really in my fields are full-time+
Remember there is quite a difference between the MSD defiinition of people who qualify for the unemployment benefit (Jobseeker benefits at June 15 = 118,072) and the StatsNZ HLFS of people who are "unemployed" (June 15 = 142,500). To compare you need to be careful not to use seasonally adjusted data.
Whatever strategies MSD uses will have no impact on how StatsNZ collects its HLFS data.
http://www.stats.govt.nz/browse_for_stats/income-and-work/employment_an…
Note that those who are sickness, caregivers, invalids, are shifted to "those not in the labour force"
Otherwise WINZ wouldn't be allowed to shift them off the unemployed benefit.
consider also the "unemployed" includes those applying for work/starting within that month period. Which theoretically is all those on an Unemployment benefit, but not those on other benefits.
But it does include all those who are in a standing down period, redundant, on leave, or in training and applying, or who are supported dependents applying for positions. but not those I mentioned, who are in the group "not available"
I wonder if we use the term "personal capital" (the value and resources and rights of a person) vs "human capital" (the collective human resources owned by a leader) it would come across more positively.
The key thing all the professions require is some form of tertiary education – essentially the growth in employment in this area mirrors the growing tertiary education sector.
.....
So that is a result of education for residency? I suppose they are a dominant political force too?
Or baby boomers hogging all the jobs?
When we think about employment shouldn't we also think about job satisfaction since there is a world of difference between a job that is motivating and one that is the pits?
We welcome your comments below. If you are not already registered, please register to comment
Remember we welcome robust, respectful and insightful debate. We don't welcome abusive or defamatory comments and will de-register those repeatedly making such comments. Our current comment policy is here.