
By Lowell Manning*
The concept of “affordable housing” is political propaganda, a hand washing exercise so governments can “feel good” while household home ownership rates in New Zealand continue to fall.
Property, especially residential property, is one of the few genuine “markets” left in New Zealand. It is neither affordable nor unaffordable. It simply reflects what buyers can and will pay and sellers will accept at any given place at any given time.
Everyone in the property business knows that property values are the sum of the land value and the value of improvements.
The main value of the improvements is the house or other building on the land. That building has a cost made up of materials, labour, council and government compliance costs and the like.
The cost of housing in New Zealand has not been rising quickly. For example, the capital goods price index for residential housing in New Zealand rose just 4.7% between December 2010 and December 2012[1].
Much of that increase is in higher regulatory costs caused by builder registration, double glazing, permit fees, better earthquake standards and the like over which people building or buying houses have little or no control.
There are regional variations in construction prices but they are rarely substantial. Every valuer takes the cost of a new building and reduces its value according to its age and condition. The improvement value is based on objective costs and has nothing to do with speculation.
A cheaper building has to be smaller and simpler and use relatively lower grade fittings, because everything else is controlled by the applicable standards and regulations. So, a government that talks about a cheap or affordable house it is really talking about a lesser house in respect of size, comfort and quality.
Since house “costs” do not govern the variation in property values, the land value must be doing so. Wide variations in land values mean they are subjectively assessed according to location and demand. Those factors determine the relative value of land from one place to the other, but not the value of the land in aggregate.
The aggregate “value” of the land portion of the property is determined by the pool of investment money available to purchase and exchange it, not by the land itself or government policy.
Residential property forms a large part of the value of unproductive capital investment in all developed countries. When the banking system deposits increase sharply, so will land prices in aggregate, and therefore property prices in aggregate, but not the prices of the improvements on them.[2] In New Zealand, the monetary stock M3 has risen moderately quickly over the past three years. House prices are changing because the investment pool is getting bigger all the time as shown in Figure 1 below.
The year to year correlation of the two graphs in Figure 1 is low because housing is only one of four areas of non-productive investment, the others being equities, government and commercial paper, and bank deposits. Investors always have a choice where to invest. For example, during the dotcom boom, equities were preferred relative to residential housing. House prices at that time fell briefly while bank borrowing surged. The M3 data also reflects changes induced by offshore “crises”. From 2002 to 2007, after the dotcom crash, housing was relatively preferred to other forms of investment as Figure 1 shows clearly. The plunge in property prices in 2008 and 2009 largely reflects investor withdrawal from the housing market in sympathy with the US housing crisis even though that had no connection with house prices or “the affordability of housing” in New Zealand. In the March years 2011 and 2012 house prices rose less than M3 because equities prices rose very quickly. Yet there was no move by the New Zealand government to restrain the New Zealand share market!
Figure 1:New Zealand 1993-2013 % Change in House Price v 0.945*M3[3]
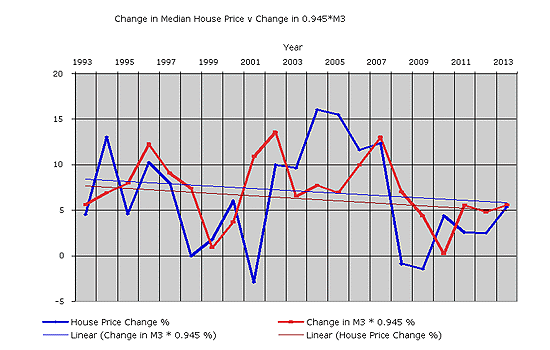
Note: 0.945*M3 is used in the graph because the productive transaction account deposits used to physically generate the GDP are not part of the non-productive investment sector. The author estimates the productive transaction account deposits are presently about 5.5% of GDP in New Zealand. So 5.5% has been deducted from M3 to give the total of 0.945*M3 investment sector deposits.
The trend lines in Figure 1 rest almost on top of one another. That shows that over the past 20 years house prices have followed the money supply (0.945*M3) available to the investment sector, not the physical cost of building houses or of developing land.
A government or a territorial authority that “forces” housing development in chosen areas is literally squeezing on a housing balloon. In New Zealand, for example, the government intends to subsidise “greenfield” subdivisions in the outer suburbs of Auckland. That will not reduce land prices in aggregate because the sale and purchase of that new residential land will still increase the money supply. The new investment will be mainly funded by new bank debt. That new money will add to M3 and grow the available investment pool and so cannot make property prices “more affordable” as the government seems to think.
The only way to reduce the rise in real property “values” in aggregate, and residential housing prices in particular is to slow the increase in the money supply as a whole. Unfortunately for the government the money supply growth in the existing debt-based financial system is systemic. It cannot arbitrarily be reduced below the trend line shown in Figure 1 without wrecking the economy.
The mechanics of the debt system [4] require that the total money supply increase by an amount sufficient to cover systemic inflation (presently about 1.75%) plus “growth” (say1.5% after deducting a productivity increase of about 1%)[5] plus domestic deposits that result from the current account deficit. In New Zealand, those last are presently increasing at nearly 4% of M3/year, and, according to the recent government budget, will increase faster in coming years. That’s about 7.25% altogether. To keep the economy above water, M3 presently needs to grow faster than the trendline shown in Figure 1, not slower [6]. The most practical way for New Zealand to manage property inflation in the absence of broad financial reform is to stabilise the current account and begin reducing foreign ownership of the domestic economy.
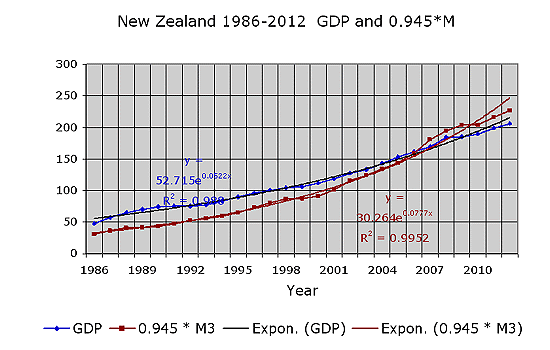
As discussed below, the excessive investment sector growth in debtor countries like New Zealand is related to the sale of productive assets to foreigners on the current account. When New Zealanders sell assets to foreigners those sellers then have an equivalent amount of domestic currency deposits they must invest. Figure 2 shows the correlation between 0.945* M3 and GDP for the 26 years since the New Zealand dollar was floated in 1985. While the correlation is almost 1, the series have not increased at the same rate due to the impact of surplus deposits arising from the current account deficit. Figure 3 shows M3* 0.945 and GDP plotted against time.
Figure 2: New Zealand 0.945*M3 v GDP 1986-2012.
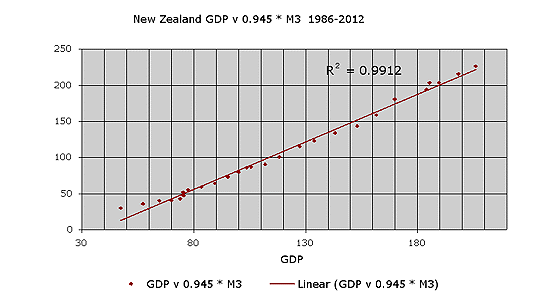
Figure 3: New Zealand 1986-2012 Growth of GDP and M3*0.945
Source: New Zealand National Accounts – March Years
The trendlines in Figure 3 are exponential because the payment of deposit interest in the interest-bearing debt system creates systemic inflation as mentioned on page 4. The net additional flow of deposits from the current account deficit creates a different exponential rate of growth of the investment sector relative to GDP. That differential rate of growth has been about 0.7%/year over the period 1986-2012 [7].
Due mainly to the current account deficits, the investment sector has grown at 5.9%/year while nominal GDP has grown at 5.2%/year over the same period. That is why prices in the non-productive investment sector are “overvalued”.
While nominal GDP has grown by $159.2 billion, 0.945*M3 has grown by $196.3 billion, a difference of $37.1 billion. That extra $37.1 billion represents surplus deposits over and above those needed to fund the principal outstanding on capital investments in the capitalist system[8].
The author’s paper “The DNA of the Debt-Based Economy” demonstrates that GDP equals the outstanding principal on capital investments [9]. Were the growth of 0.945* M3 to exactly follow the growth of nominal GDP, the increase in the prices of existing capital assets in aggregate would mirror GDP growth. As shown in equation (1) below, it is mathematically impossible for the total deposits to be lower than the existing interest-bearing debt in the capitalist system after subtracting the banks’ residual (net worth) that they have “captured” from the deposit base (mostly their net retained profits) and the country’s net foreign currency debt.
Debt is linked to deposits and the current account/NIIP [10] by the formula:
(DC + NFCA) = M3 + Residual (1)
Assets = Deposit Liabilities + Net worth
The formula represents the basic accounting equation viewed from the banks’ point of view, where DC is Domestic Credit, M3 are the total bank deposits, NCFA is the Net Foreign Currency Assets of the banking system and Residual is the net worth of the banking system. The Residual is positive when the equation is in that form, and NFCA is negative for debtor countries.
The numbers for New Zealand in December 2012 were [11]:
DC was $333.2 billion
NFCA was $-52,6 billion
M3 was $ 253,6 billion
Residual was + $ 27.0 billion
Applying Formula (1) to New Zealand at the end of December 2012 gave
$333.2 b - $52.6b = $253.6b + $27.0b
At that time,
- New Zealand’s accumulated current account deficit was $203.8b and GDP for the 12 months ended December 2012 was $209.3b,
-$151.2b (203.8- 52.6) of the deposits created to fund the accumulated current account deficit had therefore been returned to New Zealand in the form of foreign ownership,
-$209.3b x 1.055%, or $220.8b of the $253.6b M3 deposit base was needed for capital and to fund the productive transaction accounts[12]
Between 1985 and 2012 New Zealand “imported” net surplus deposits amounting to $151.2b - $220.8b or $30.4b through its current account. The situation would be $52.6b worse still were ALL the deposits created to fund the accumulated current account deficit returned to New Zealand in the form of foreign ownership, as could theoretically happen over a relatively short time span. The $52.6 billion borrowed offshore by banks operating in New Zealand has temporarily frozen their release for the purchase of assets in New Zealand.
Recent IMF comments that housing in New Zealand is “overvalued” by about 20% are directly related to the surplus $30.4 billion of net surplus deposits imported through its current account. This is about 17% of GDP when the pre-1985 surplus (referred to in footnote 8) is included. That IMF comment reflects an ideological bias against housing because surplus bank deposits have a similar effect on all other non-productive investments too, including share market equities. That is why there are regular share market collapses!
In New Zealand, if the government were to somehow succeed in “slowing down” the housing market, the unintended consequence would be to “overheat” the rest of the investment sector. Debtor countries themselves, not the foreign investors, pay for the foreign ownership they cede on their negative current account. Very few people understand that, because few understand how the foreign exchange process works[13].
New Zealand therefore remains at risk of further asset inflation should the present arbitraging of interest rates by the New Zealand banks be reversed. As shown on page 7, the banks have borrowed a net amount of $52.6b offshore. They have done so because it is cheaper for them to do that than pay deposit interest in New Zealand. The arbitraging is sustained by New Zealand’s relatively high domestic interest rates. When viewed from that perspective, the international rating agencies can be forgiven for keeping an eye on New Zealand’s current account.
International financial institutions are concerned with financial stability. They are not concerned about the economic asymmetry that foreign ownership of a domestic economy creates. Nor are they concerned about domestic imbalances in wealth and income distribution. If the banks were to stop borrowing money abroad to finance their operations, most of the NFCA of $52.6 billion would be invested in existing assets in New Zealand, driving their prices up.
The main options
There are two main options to “pop” the housing “investment bubble”. Neither of them has anything to do with building houses!
Either the proportion of the available M3 investment funding ($253.b*0.945) now actively used to purchase and exchange existing non-productive residential property and other non-productive assets is reduced, or the investment pool M3 itself needs to be reduced through progressive debt retirement, starting with foreign debt.
The New Zealand government appears to support the first option in the form of higher mortgage deposits and tougher bank lending criteria. That makes the purchase of residential housing more difficult for the man in the street, especially for first home buyers, but it will have little affect on the speculative residential market that tends to use existing deposits to purchase and exchange existing assets.
The government proposals would have their main impact on ordinary people who borrow from the banks to pay for their homes, making housing less available to them. The result would be to reduce household home ownership rather than increase it. How such an approach would lead to more “affordable” housing for homeowners is anyone’s guess.
The second option makes more sense because it removes a primary source of the structural asset “bubble”, namely the persistent growth of foreign ownership through the current account.
Reversing that growth means managing the exchange rate, but the government and it advisors like the Treasury and the Reserve Bank of New Zealand claim there is no viable policy tool available to do so. They are wrong.
The government could easily set up a variable and tax neutral Foreign Transactions Surcharge (FTS)[14]. The FTS is an automatically collected levy on all outward domestic currency transactions passing through the foreign exchange interface. Its effect is to increase the aggregate cost of repatriating domestic currency offshore and lower the aggregate cost of using domestic currency locally.
The revenue obtained from the levy would be used only to reduce domestic taxation and to begin repayments of foreign debt, in effect repurchasing those assets already ceded to foreigners. While an FTS will correct the exchange rate and current account it will have little immediate effect on investment prices or the property market. It would instead lead to a gradual easing of the rate of investment price increases over time.
The myth
There is no such thing as affordable housing. There is just a housing market.
Aggregate prices in that market are structural.
Any government attempt to manipulate the market without addressing the structural causes of property inflation will fail.
The sooner the government introduces a program to resolve the main issue of foreign ownership generated through the current account deficit, the sooner house prices will become more stable.
-----------------------------------------------------------------------
[1] Source: www.stats.govt.nz capital goods price index
[2] This is true for all non-productive investments in equities and commercial paper as well. The relative weighting of non-commercial property, equities, government and commercial paper, and bank deposits depends on regulatory policy settings such as tax rates, lending criteria, subsidies and the perceived impact of offshore events.
[3] The housing data is interpolated from Real Estate Institute of New Zealand (REINZ). That data is global only and subject to further research. The M3 data is for March years and is from Reserve Bank of New Zealand Table C3 (historical).
[4] Fully described in a paper by the author “The Ripple Starts Here” given to the New Zealand Association of Economists’ 50th annual conference July 2009. The paper develops a simple debt model of the economy. It is available, together with later updated papers at www.integrateddevelopment.org. Systemic inflation is the net deposit interest paid on deposits. The systemic inflation rate is the net interest expressed as % GDP.
[5] A positive balance of trade is counted as GDP “growth” but it does not appear in domestic deposits because it is “used up” to reduce the size of the current account deficit. The GDP “growth” figures in the official data for New Zealand are artificial because the positive trade balance “disappears” from the domestic economy. Similarly, heavy discounting of consumer goods and services (among several other factors) masks systemic inflation. That is why measured CPI inflation in New Zealand is shown as just 0.9% in the March 2013 year instead of about 1.75%.
[6] The actual M3 growth from February 2012 to February 2013 was 7.5%.
[7] The exponentials shown in Figure 3 (5.2%, 7.8%) cannot be compared directly because the curves in Figure 3 have different starting points. If the data series are set at the same starting point (52.7) the 0.945*M3 exponential would be 5.9 instead of 7.8. This shows that 0.945*M3 increased 0.7%/year faster than GDP from 1986-2012.
[8] The total surplus is more than $37.1 billion because the accumulated surplus from before 1985 needs to be added. The total is thought to be a little over $40 billion.
[9] Available at www.integrateddevelopment.org
[10] The Net International Investment Position, (NIIP) might better be a little more accurate but the author uses the current account for simplicity.
[11] The debt figures used in this article exclude secondary savings and loan debt such as the on-lending of deposits through finance companies and other non-bank financial institutions. Secondary debt is thought to amount to about 10% of Domestic Credit in New Zealand but it is higher in some overseas countries, notably the US.
[12] The productive transaction accounts in New Zealand are about 5.5% of GDP
[13] Lowell Manning, 2011, “The Savings Myth” Section 4 www.integrateddevelopment.org
[14] Full details are available from www.integrateddevelopment.org and from www.sustento.org.nz or from the author manning@kapiti.co.nz
-----------------------------------------------------------------------
Lowell Manning is a researcher at the Sustento Institute. You can contact him here »


We welcome your comments below. If you are not already registered, please register to comment
Remember we welcome robust, respectful and insightful debate. We don't welcome abusive or defamatory comments and will de-register those repeatedly making such comments. Our current comment policy is here.