

The growth of our housing markets may be reaching a 10-year high. Indications are that the recent rapid run-up in values may be topping out, and falls are now a real possibility.
Our housing markets are large.
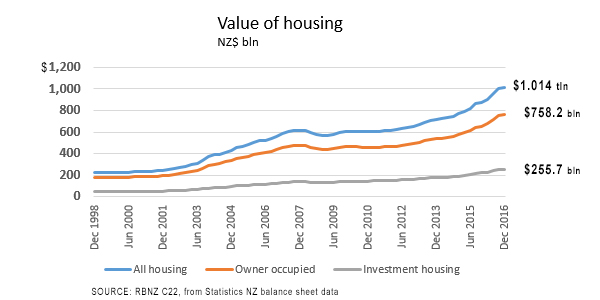
The value of all houses topped NZ$1 tln in mid 2016, having grown by a remarkable +55% in the past five years. In dollar terms, that is a rise in asset "values" of more than $350 bln. In 2016 alone, those values rose +$140 bln, a gain of +16%.
To put that in perspective, our economy grew by $261 bln in the same period, an impressive +7% rise in nominal terms. (Housing value growth is not included in GDP. GDP is a measure of economic activity, not values.)
So, in 2016, housing values rose at more than twice the rate the general economy did.
While that is probably no surprise to interest.co.nz readers, today's values are clearly not sustainable.
It is likely that housing values now represents about 20% of all the country's domestic assets1. We estimate that is up from 16% just five years ago. But interestingly, ten years ago after the heady days pre-GFC (and pushed ahead by the 39% income tax rate that encouraged many taxpayers to seek 'tax-advantaged investments') the value of housing represented 25% of all the nation's assets.
The languishing of house prices in the five years post 2008 were crucial in getting the balance back to 16%.
New data can allow us to drill into the nature of these remarkable changes - even if we can't drill into regional components.
The RBNZ now classifies investor housing as a business asset. We can track that by deducting owner occupied housing from total housing values, as this chart does.
Further, Statistics NZ publishes data for the tenure of housing. By relating the value of all housing to the number of houses, we can get an average value and track it over the past 18 years.
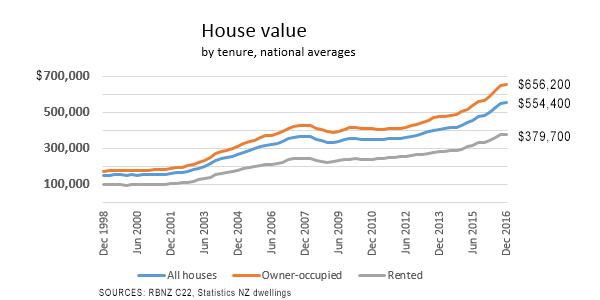
As you would expect, that confirms the value of owner-occupied houses is much higher than houses rented. But the calculation also reveals the size of the housing wealth divide between owners and renters. Owners live in houses valued at about +75% more than renters do.
The data behind the RBNZ series comes from CoreLogic, and the base is LINZ title transaction data. That is different to what we often publish, which is REINZ data, which in turn is based on 'unconditional contracts'. So a final review matches these series and is best done by showing how each tracks changes in values.
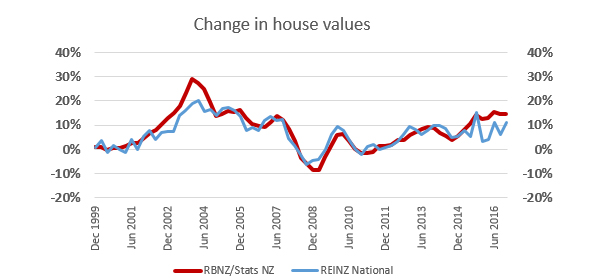
New Zealand's housing markets may have come to the end of a cyclical upturn. What happens from here is uncertain, but looking back over previous cycles is one aspect to consider.
If history is any guide, (and if we are really at a real estate market turning point), we may be in for five plus years of stagnant or declining house values.
The last time this happened, housing moved down from 25% of the nation's assets to 16%. The removal of the 39% tax rate had households reassess the attractiveness of tax-free housing gains, and the real economy's assets grew strongly.
But the sharp drop in yields driven by international quantitative easing and drop in interest rates for savers, changed the game again, and tax-free housing gains became popular with a renewed splurge. Excess liquidity fueled an asset boom, and New Zealand's housing values rose quickly to claim the 20% share.
Now, the tables are turning again. Without capital gains, housing 'investors' face capital losses that can easily overwhelm the very skinny earnings yields that are committed to. A new, more fierce reassessment is upon us. Quitting rental investments may well involve the choice of 'losses now', or break-even cash flows and potentially larger 'losses later'. Unless your outside cash flows can last at least five years of holding cost.
And if the real economy trucks along as well as it is currently, that share of the national assets represented by housing could fall quite quickly.
In these circumstances, small business ownership is likely to make a strong comeback for investors who don't want to suffer the tyranny of low yields.
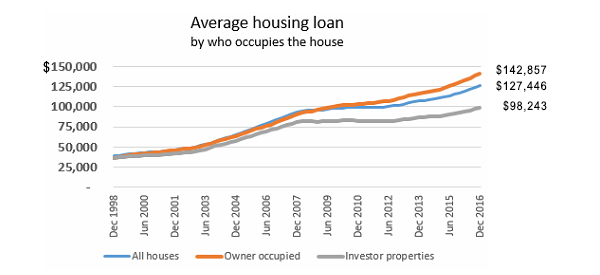
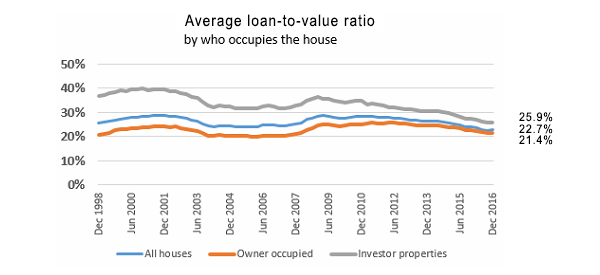
And, in case you were wondering, here are the average loan size by tenure, and the average LVR. This data does not tell us what new loans are being committed at, but rather the average over the whole housing market.
Note:
1. The RBNZ and Statistics NZ produce a valuation of all house values quarterly (M10). Separately, Statistics NZ produces annual balance sheets for the New Zealand economy - that don't seem it include housing values. We have added the house values to the Annual Balance Sheet data, and made some simple timing adjustments to make the data consistent. The resulting percentages referred are ours, and not sourced directly from either Statistics NZ or the RBNZ.
We welcome your comments below. If you are not already registered, please register to comment
Remember we welcome robust, respectful and insightful debate. We don't welcome abusive or defamatory comments and will de-register those repeatedly making such comments. Our current comment policy is here.