

A new report from the New Zealand Infrastructure Commission says the country would need to spend around 60% of its infrastructure investment just to keep on top of NZ’s current infrastructure – rather than invest in building more.
The report, released on Friday, says it’s the first “comprehensive and consistent” view of the value of NZ’s infrastructure assets. It focuses on the supply of NZ’s infrastructure including how much the country has and how much NZ is investing in it.
Using data from Statistics NZ, the Commission’s report found the country’s infrastructure assets, excluding land, were valued at $287 billion in 2022 and the value of New Zealand’s infrastructure assets is rising over time.
Peter Nunns, the New Zealand Infrastructure Commission’s Director of Economics, says nearly three-quarters of NZ’s infrastructure assets are publicly owned through central and local government, with over one-quarter are commercially or privately owned.
Breaking it down further, $129 billion or 45% of this infrastructure is owned by central government, $76 billion or 26% is owned by local government, and $82 billion or 29% is commercially or privately owned.
The report says infrastructure assets comprise just over a quarter of all fixed capital assets in the New Zealand economy as the value of NZ’s total net capital stock – which isn’t just infrastructure – was $1.11 trillion in 2022.
“Infrastructure assets can have huge benefits for society, but they must be maintained, renewed, and repaired to ensure that they continue to provide those benefits - and that costs money,” Nunns says.
The report found between 2013 and 2022, depreciation costs for infrastructure were equal to 58% of new capital investment.
“For every $10 we spent on new infrastructure, almost $6 of existing infrastructure wore out,” the report says.
This leaves only $4 out of every $10 of investment available for new or improved infrastructure.
On the other side of that coin, the inflation adjusted value of NZ infrastructure assets has also risen per person from $32,900 in 1990 to $55,800 in 2022. This is a 70% increase in per-capita infrastructure assets, the report says.
This consisted of an 88%, or $34,100, increase of horizontal infrastructure assets – transport, electricity/gas, water/waste, and telecommunications infrastructure – and a 47%, or $21,700, increase in vertical infrastructure assets – education, hospitals, public administration and safety, including defence, social housing, and other types of public capital.
The report says this suggests the quantity and quality of infrastructure is rising “significantly faster” than New Zealand’s population.
Enough investment?
Nunns says it’s a question of if NZ is currently investing “enough” on renewed infrastructure.
“In some areas, like electricity distribution, the data suggests that assets are being renewed at about the right rate. But in other areas, like state highways, local roads, and water infrastructure, renewal investment seems to be too low to ensure our assets are maintained for the long term. If this trend continues, the condition of our infrastructure will decline,” he says.
“What’s even more concerning is that in some sectors, like education, health, and justice infrastructure, we couldn’t find good data on maintenance and renewal spending. This is because central government, which owns most of these assets, does not compile and publicly report this data.”
The report found current investment rates signal likely future investment levels and pointed to infrastructure investment made between 2003 and 2022 averaging 5.8% of gross domestic product (GDP).
Of that 5.8% GDP figure, 3.4% was spent on ‘horizontal’ infrastructure – like transport, electricity, water and telecommunications networks while 2.4% was spent on vertical infrastructure – like education, hospitals, social housing, and defence infrastructure.
It’s noted in the report that because NZ is investing “a roughly constant share” of GDP in infrastructure, and because GDP is growing over time, “the dollar value of infrastructure investment is rising both in total and in per-capita terms”.
“Sustaining higher investment would require us to increase taxes, rates, or user charges, while lower investment would require us to accept less or lower-quality infrastructure,” the report notes.
“In this context, it may be possible to modestly increase the share of GDP we invest in infrastructure, but it is more likely that we look for ways to change the mix of investment to better meet our future needs.”
20 Comments
What doesn't help is our propensity to build to the minimum possible physical and organisational standards. Those need to get looked at as well, as we just won't get out of our own way.
Think about -
The way we make roads, where we essentially just use tar and chip to waterproof a rolled aggregate base, called flexible road surfacing, rather than building up a fully formed road base that is much more durable. The rest of the developed world can build roads that cope with heavier vehicles than we have here: why haven't we used the higher RUC's on heavy vehicles to cope with rising vehicles masses?
Our railways are on a 3'6" narrow gauge which was very short sighted - but so are Queensland's and they run a great deal of freight and passenger services at 100KpH by investing in decent rail beds and newer technology rolling stock.
And the uncoordinated way we put in underground services, where one thing get renewed and another agency comes along in a few months to dig it up again to replace something else, or repair the damage done by the previous work.
Where rigid planning still militates against creative solutions to development that would make infrastructure more affordable and sustainable: why should a green-field development be mandated to be Stepfordesque low density stand-alone houses rather than a stylish row-house development with shared land and far lower infrastructure burden?
Like half a million dollar pedestrian crossings. Solid as…wait, need to remove, doh!, wrong road.
Turned out that was a dishonest hit job, though.
re ... "The way we make roads, where we essentially just use tar and chip to waterproof a rolled aggregate base, called flexible road surfacing, rather than building up a fully formed road base that is much more durable."
The way we made roads was fine until the number of heavy goods vehicles increased. And then increased again with the NACT allowing even heavier trucks.
It's heavy goods vehicles that do the bulk of the damage to our roads, e.g. double the weight and you get 10 times the damage., quadruple the weigh and you get 100 times the damage. This results in NZ having to spend way, way more on a single stretch of road if heavy goods vehicles use it.
But hey - you voted for this. Me? I like trains. They don't really care how heavy the goods are. ;-)
100%. Was taught at Uni that road damage is proportional to the cube of axle weight. This can be mitigated somewhat by more axles - though that still increases the damage linearly. I've watched firsthand multi-axle trucks tearing up large amounts of seal during tight turns - one particularly egregious case was a truck doing a u-turn down the cul-de-sac at the end of Onehunga Mall Extension - it had just had it's potholes repaired and the whole thing resurfaced the previous day, and his triple-axle trailer completely destroyed it, ripping all the seal off like tearing skin.
Also sick of rural roads being destroyed by 50T logging trucks who contribute very little to the community except excessive wear and tear on public services.
Taxpayers being made to subsidise heavy trucks / road transport lobby. Wonder who is getting most donations from that sector?
Meanwhile, apparently we can subsidise heavy trucks but we need to clamp down on the poor...
Couldn't have said it better to all of the above commentators. Our tax settings have been inequitable for far too long. RUCs for heavy vehicles have always been way, way, way undertaxed. I think its an agrarian hangover combined with government turning its back on rail during the neoliberal asset fire sale - and then the asset=strippers who subsequently owned it doing such a great job of squeezing it dry.
The double dipping on infrastructure is often seems to be deliberate on the part of the contractors supplying the services.
E.g., I had a friend consulting on a big water project in Hamilton, which was done in two parts - in the same location. She said the contractors were quite open about how they'd tendered to do it in two parts so they would increase their take (at least to people who didn't matter). Comes out of the public coffers, so who cares?
Same with rural fibre roll-out for schools. They dug ditches, and ran a single conduit. When it came time for the community connection - oh we need to dig up and run another conduit because we're not allowed to use the school one. This was known at the time of the initial rollout - but they get more money for doing it twice - when they could've simply run two conduits with the initial dig.
4 times past my place. Now they are talking about adding Fibre on the powerlines as well.
Blah blah blah blah blah blah blah blah blah blah blah blah
This country is great at the talk, rubbish at the action
weren’t we supposed to be ‘can-do’ prople?
Not any more: actually doing something is a good way to get attacked for not including everyone.
Priorities are all over the place and generally its all last minute and not preventative maintenance . Plenty of let it get run down so we can get new . All symptoms of the crisis economy many NZers seem to feel very comfortable with . I guess theres also the power trip that comes with having an investigation as too why it all failed so miserably ....lol . Nothing will change everyones waiting for the next disaster (crisis) to roll in so they whack on some Hi Viz and feel important.... Dont forget to boil your water first....lol
Really useful information. This is an issue that stands out for me and has done for years of looking at LG accounting/expenditure;
The report found between 2013 and 2022, depreciation costs for infrastructure were equal to 58% of new capital investment.
In LG terms, councils can choose to defer depreciation on specific assets and more should use it. But it isn't a proper 'fix' in terms of how depreciation is applied to LG assets. That needs specific legislative review.
Normal commercial rules and practices with respect to the treatment of depreciation don't align to the local government financial model well at all - and these charges make up such a huge percentage of overall rates charges. From a ratepayer perspective, it's a lot of money for nothing as it is not as if councils create any capital reserve funds set aside for asset renewal as they have to write a balanced budget each year.
+1
Local government needs to be regulated by central government to:
1) fully cover depreciation first and ensure it goes into a capital reserve to fund maintenance works.
2) do business cases on all spending and prioritise spending on that basis. Vanity projects come last.
3) as an arm of government limit rate rises to the target inflation band. Ratepayers cant keep paying 15%+ rate rises.
This will mean rightly canning a lot of capital works and lowering service levels. NZ is a poor country & we need to recognise it.
The 3 Waters mess we have is purely due to local government's largess on "vanity" and other projects ahead of properly funding and maintaining assets.
And who is going to regulate central government? Per the article they have the worst or least transparent maintenance record!
Look, here's another one of these useless commissions. What have they achieved. Whenever I see these articles I wish I could post a thumbnail of Gliding On.
Way to out yourself. This is probably one of the most useful Commissions we have.
This report (building upon previous reports) - https://tewaihanga.govt.nz/our-work/research-insights/the-decline-of-ho… - completely upturned how people understood our housing dynamics.
Their findings were unassailable and resulted in the culprits (Councils) having to act. (The AUP of 2016 was likewise the result of work they'd done.)
They get close, but like so many, they're linear-thinking.
'this leaves only $4 out of every $10 of investment available for new or improved infrastructure'.
They should have continued: 'at this snapshot point in time'.
Because degradation is exponential; compound. And we've never had more infrastructure, aging. So that 'left over' percentage will get less, over time. Which is why we can't afford 3 waters - either as taxpayers, ratepayers, or private debt-repayers. We simply have to back off; simplify, consolidate, resilient-ify. This conversation is unfolding - no bad thing.
Nunns is a green-new-deal optimist type; closer to the truth than the 3-clown circus, but still has some way to go. The reduction in energy-input, will see us triaging inside specialist areas, and vis-a-vis all areas, more and more as time passes. Forget new builds; we'll be unable to maintain at all by 2030; that $4 will be completely swallowed up.
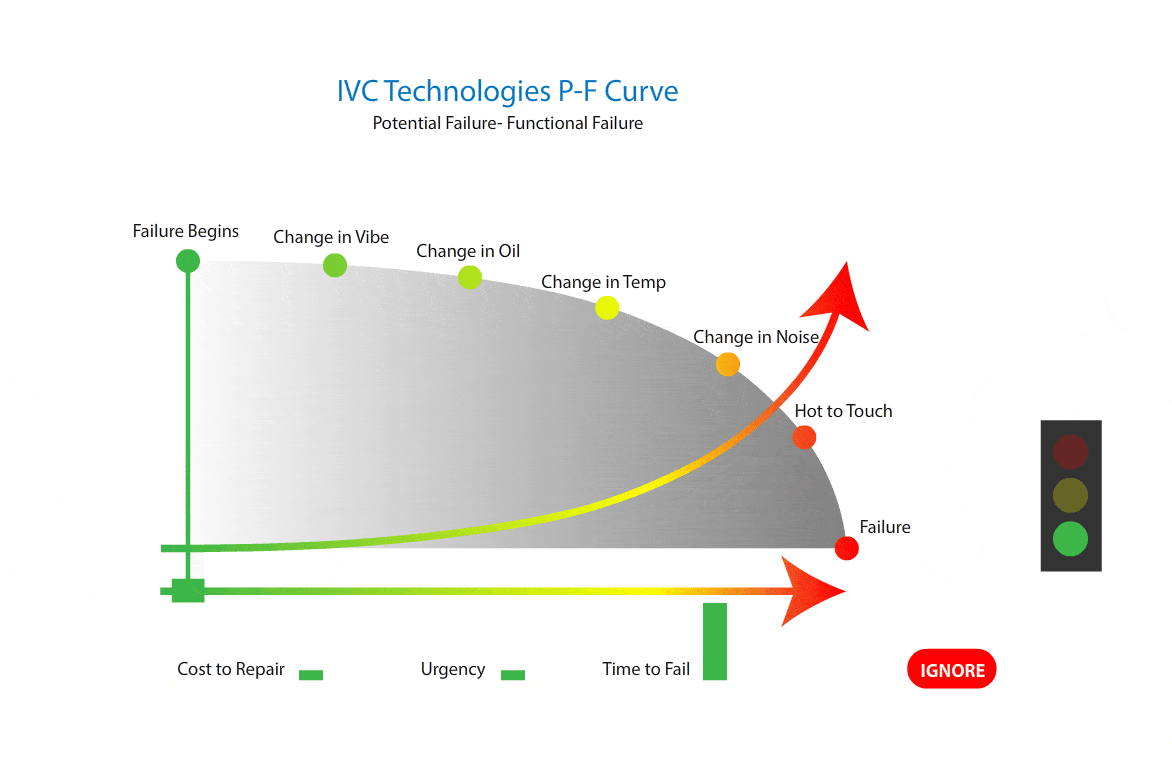
A nice simple graph reflecting what you said about maintenance ... P-F Curve.
https://ivctechnologies.com/wp-content/uploads/2019/07/P-F-Curve.gif
Digital twins will be key here. Just ones that aren't a tax payer rort.
We welcome your comments below. If you are not already registered, please register to comment
Remember we welcome robust, respectful and insightful debate. We don't welcome abusive or defamatory comments and will de-register those repeatedly making such comments. Our current comment policy is here.