The following is a re-post from the World Gold Council. The original is here.
Gold is an attractive means of helping investors diversify their portfolios. Its relative scarcity supports its long-term investment appeal. But its market size is large enough to make it relevant for a wide variety of investors, from individuals to institutions and central banks.
This Primer gives an overview of the available above-ground stock of gold, the relative size of the financial gold market, and the composition of demand and supply that supports gold’s investment credentials.
- We estimate that approximately 209,000 tonnes of gold – worth US$12tn – have been mined throughout history1
- Jewellery makes up almost half of these above ground stocks, while gold in investment form (bars, coins and physically-backed gold ETFs) accounts for almost a quarter
- The physical financial gold market – made up of bars, coins, gold ETFs and central bank reserves – is worth nearly US$5tn, almost 40% of the total
- The size of the market means it can absorb large purchases by, and sales from, institutional investors and central banks without resulting in price distortions
- In addition, diversity underpins the stability of the gold market. Over the last three decades alone, dramatic shifts in the sources of demand and supply – both sectoral and geographic – have created a more diverse market.
A scarce asset with a large market
Gold has been prized for thousands of years. We estimate that approximately 209,000 tonnes of gold have been mined throughout human history, of which around two-thirds has been mined since 1950.2 And as gold is virtually indestructible, almost all of it is still available in one form or another.
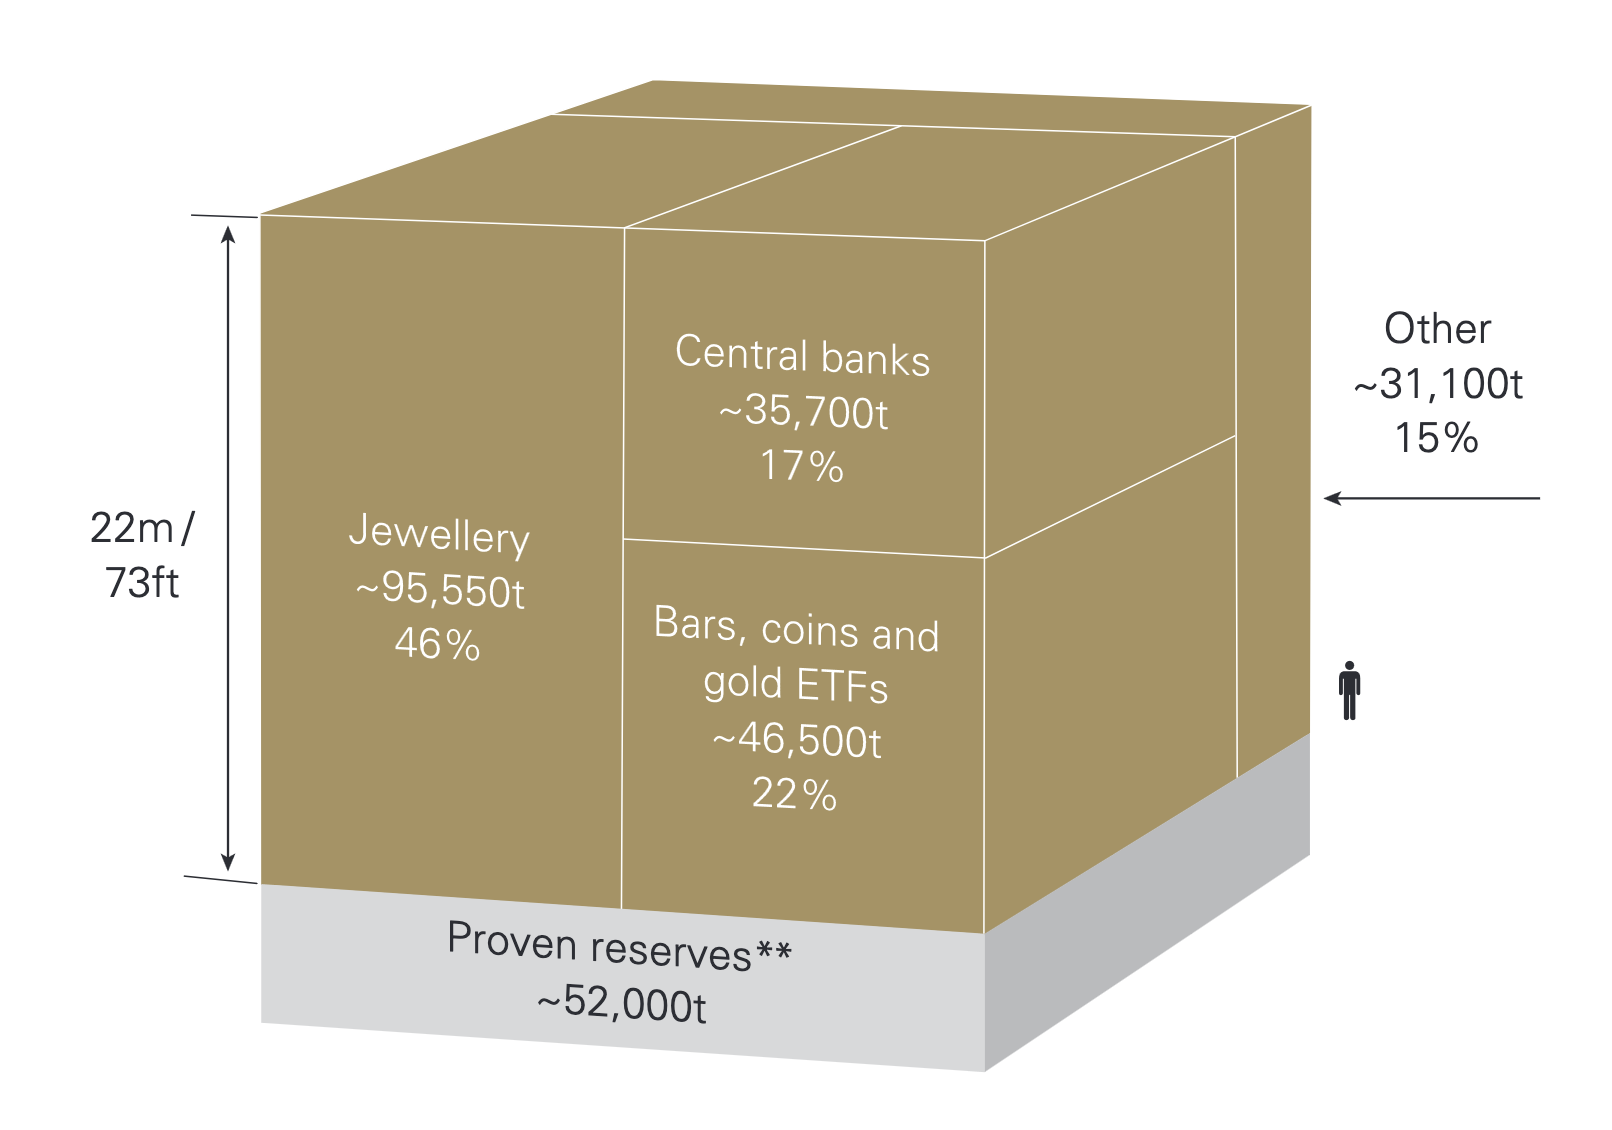
To put this into perspective, all of the above-ground stock of gold -worth US$12tn - would fit into a cube with sides of approximately 22m (73ft) worth US$12tn (Figure 1).3Of this:
- Jewellery accounts for 46% (95,547t, US$6tn)
- Central banks hold 17% (35,715t, US$2tn) as reserves
- Bars and coins represent 21% (43,044t, US$3tn)
- Physically backed gold ETFs hold 2% (3,473t, US$0.2tn)
- The remainder, primarily industrial applications and holdings by financial institutions, is 15% (31,096t, US$2tn).
Importantly, gold is a scarce element and above-ground stocks grow at a slow rate. Mine production adds approximately 3,500t per year,4 equivalent to an annual 2% increment.
Figure 1: The total amount of gold above ground is estimated at 209,000t worth US$12tn*
Source: Metals Focus, Refinitiv GFMS, US Geological Survey, World Gold Council
*As of the end of 2022. Value calculated using the LBMA Gold Price at the end of the year.
Note: Proven reserves as defined by the US Geological Survey.
Financial gold is synonymous with bullion
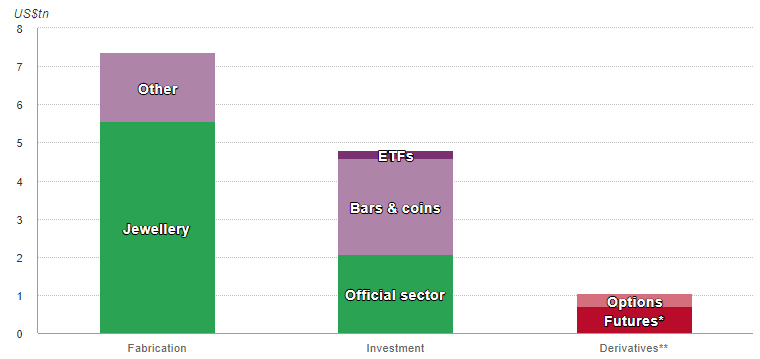
The financial physical gold market is made up of bars, coins, physically backed gold ETFs and central bank reserves; this accounts for approximately 82,200t worth US$5tn, equivalent to 39% of total above-ground gold stocks. In addition, there is a significantly smaller reported US$1tn open interest in gold derivatives (Chart 1).
Chart 1: Value of above-ground gold and gold derivatives
Sources: Bloomberg, Bank for International Settlements, ETF company filings, ICE Benchmark Administration, Metals Focus, Refinitiv GFMS, World Gold Council; Disclaimer
*As of 31 December 2022.
**Represents open interest in COMEX, TOCOM and OTC transactions.
Gold's liquidity is on a par with other major assets
Because gold can be recycled indefinitely, with only a fraction lost through technological and industrial use, a sizeable portion of the above-ground stocks can potentially be mobilised and sold on the secondary market.5 As a result, liquidity in the gold market is unmatched by most financial assets.
As well as physical gold holdings, derivatives traded on exchanges or the over-the-counter (OTC) market are available, helping to boost overall liquidity.
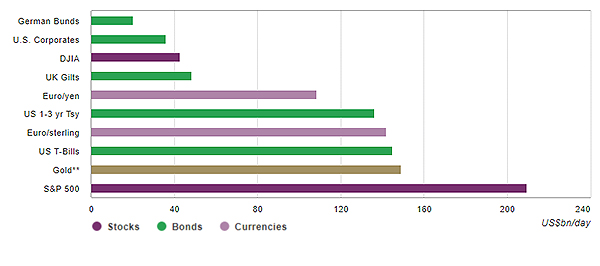
Chart 2: Gold trades more than many other major financial assets
Average daily trading volumes over the last five years in US dollars*
Sources: Bloomberg, Bank for International Settlements, UK Debt Management Office (DMO), Germany Finance Agency, Japan Securities Dealers Association, Nasdaq, World Gold Council; Disclaimer
*Based on estimated average daily trading volumes from 31 December 2017 to 31 December 2022, except for currencies that correspond to April 2019 to April 2022 volumes due to data availability. Fixed income trading volumes include primary dealer statistics only due to data availability.
**Gold liquidity includes estimates on OTC transactions and published statistics on futures exchanges, and gold-backed exchange-traded products.
The gold market is also more liquid than many other major assets (Chart 2). Gold trading volumes averaged approximately US$149bn per day over the past five years, more than the Dow Jones Industrial Average and comparable to those of US 1–3-year treasuries and US T-Bills among primary dealers.6
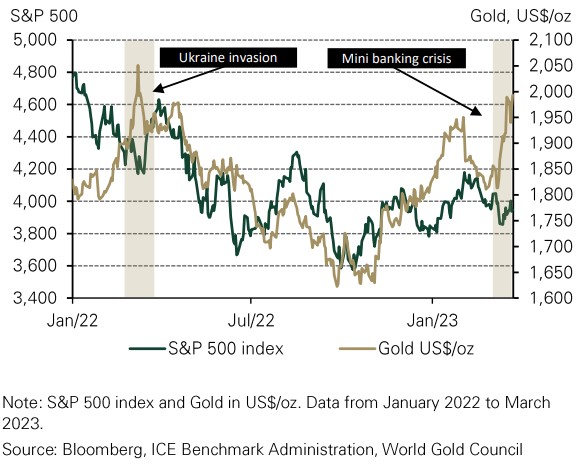
The size of the market allows it to absorb large purchases and sales from both institutional investors and central banks without resulting in price distortions. And in stark contrast to many financial markets, gold’s liquidity has not dried up, even during times of financial stress, making it a much less volatile asset.
Gold is a small but meaningful fraction of investable assets
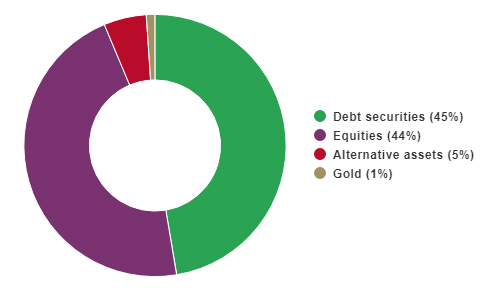
Despite being a large and liquid market, the stock of gold bullion – bars, coins and ETFs – held by investors amounts to nearly US$3tn. This represents around 1% of the estimated US$266tn invested in financial assets globally excluding foreign reserve holdings by central banks (Chart 3).7
Chart 3: Of the US$266tn invested in global financial assets, only 1% is currently invested in gold*
Sources: Bank for International Settlements, GFMS, ICE Benchmark Administration, Metals Focus, preqin, Thomson Reuters, world federation of exchanges; Disclaimer
*Estimates include the global market capitalisation of all publicly traded stocks as at end 2022; the total value of outstanding debt securities as at Q2 2022; the assets under management of alternative assets as at end 2021; and investment holdings of gold bullion as at end 2022. Central bank holdings of gold and bonds were excluded.
While this implies that, on average, investors hold approximately 1% of gold in their portfolio, the reality is that gold holdings are not uniform. Institutional investors, for example, tend to be under-allocated to gold. Yet, our analysis shows that investors can greatly benefit from a 2% to 10% strategic allocation to gold depending on their investment objectives.
Gold’s role in international reserves
Central bank reserve managers are tasked with investing vast sums of money in financial assets. While the ideal asset allocation strategy may vary for each institution, nearly all reserve managers adhere to the principles of safety, liquidity, and return.
Gold is one of several traditional reserve assets – along with the US dollar, euro, British pound and Japanese yen – mostly in the form of sovereign debt securities. Our 2022 central bank survey shows that gold’s performance during times of crisis, its long-term store of value, and its lack of default/counterparty risk are key drivers behind gold ownership.
And its importance in international reserves is clear. At the end of 2022 central banks held around 35,715t of gold according to the IMF, worth approximately US$2tn. This means that gold accounts for 16% of total global allocated gold reserves, with only the US dollar and the euro holding greater shares (Chart 4).
Chart 4: Composition of total reserves (foreign exchange and gold)*
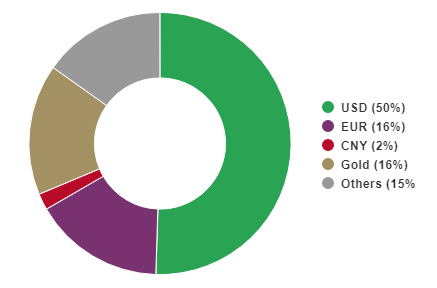
Sources: International Monetary Fund, World Gold Council; Disclaimer
*Latest COFER data available at the time of writing, was for Q3 2022. Excludes unallocated reserves. Note: We provide two separate sources for central bank data; results may differ depending on which data set is referenced. The source for our Gold Demand Trends publication and our above-ground stocks figures is primarily Metals Focus, which makes it's own estimates of official sector activity incorporating what is reported to the IMF. The source for our monthly central bank statistics is the IMF IFS statistics (supplemented with data directly from central bank websites where needed and available).
However, there can be a sizeable divergence in gold holdings among central banks. For example, in 2022 developed market central banks held, on average, 21% of their total reserves in gold. In comparison, their emerging market counterparts held just 10%, although that figure has been climbing since 2010 when central bank demand for gold expanded rapidly.
Composition and trends of gold supply and demand
The gold market draws stability from its sources of demand and supply, which are diverse across both sectors and geographies.
Supply: Gold is supplied from a mix of mined (75%) and recycled gold (25%).8 Mine production is well diversified geographically, with no single region producing more than a quarter of the global total (Figure 2). This reduces the risk of supply shocks and contributes to gold’s relatively low volatility compared to commodities whose mining is more geographically concentrated. And recycling acts as a buffer when gold from primary production cannot meet demand, responding to fill the gap and balance the market.
Demand: Gold is bought around the world for multiple purposes – as a luxury good, a component in high-end electronics, a safe-haven investment, or a portfolio diversifier (Figure 3). Gold demand is also geographically diverse, with major gold markets present across the world. Emerging markets – dominated by China and India – represent around 75% of annual global gold demand, while developed markets account for the remainder.
Major trends have reshaped gold demand
Gold has been a constant throughout human history. But over the last 30 years the global gold market has undergone significant structural change.
Wealth expansion and economic growth have been key in fuelling jewellery consumption, investment in technology and the acquisition of gold bars and coins. The introduction of physically-backed gold ETFs has also had a material impact on institutional investment demand for gold. And since 2010 central banks have shifted from net sellers to net buyers, using the asset to diversify their foreign reserves.
To read more, please see: 30 years of Gold Demand Trends
Figure 2: Gold mining is geographically diverse, helping to reduce volatility*
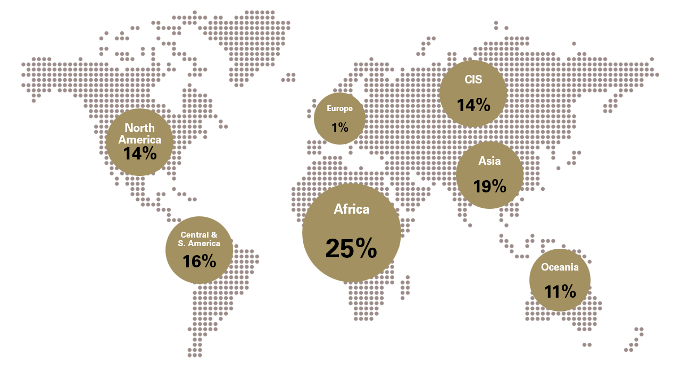
Source: Metals Focus, World Gold Council
*Computed using average annual mine production from 2012 to 2021.
Figure 3: Gold has a diverse demand base: a luxury good, a technological component and an investment
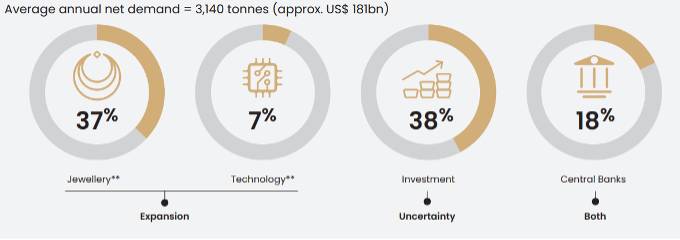
Source: Metals Focus, Refinitiv GFMS, World Gold Council
*Based on 10-year average annual net demand estimates ending in 2022, including jewellery and technology net of recycling, in addition to bars and coins, ETFs and central bank demand, which are historically reported on a net basis. It excludes OTC demand owing to limitations in data availability. Figures may not add to 100% due to rounding. US dollar value computed using the 2022 annual average LBMA Gold Price PM of US$1,800.1/oz.
** Net jewellery and technology demand computed assuming 90% of annual recycling comes from jewellery and 10% from technology. For more details, see: https://www.gold.org/goldhub/research/market-primer/recycling
Footnotes
 Our free weekly precious metals email brings you weekly news of interest to precious metals investors, plus a comprehensive list of gold and silver buy and sell prices.
To subscribe to our weekly precious metals email, enter your email address here. It's free.
Comparative pricing
You can find our independent comparative pricing for bullion, coins, and used 'scrap' in both US dollars and New Zealand dollars which are updated on a daily basis here »


We welcome your comments below. If you are not already registered, please register to comment
Remember we welcome robust, respectful and insightful debate. We don't welcome abusive or defamatory comments and will de-register those repeatedly making such comments. Our current comment policy is here.