

Here's our summary of key events overnight that affect New Zealand, with news the US jobs growth ADP reported yesterday was not followed up today in the official report.
In the US, their jobs recovery lost some steam in December, with the level of new jobs created coming in at +148,000 and well below market expectations and the lowest December in the past four years. Their retail sector lost more than 20,000 workers. The December unemployment rate was steady at 4.1%. Annual wages growth crept up from +2.4% in November to +2.5% pa. There were revisions in the job growth data for October and November but together they resulted in a small decline. Their participation rate is 62.7%.
Equity markets have pretty much ignored the data with the S&P500 up +0.5% on the day, but the US dollar has retreated and bond prices fell.
The jobs story was better north of the border. Canada’s unemployment rate dropped to a 42 year low in December of 5.7% and job creation exceeded expectations by a wide margin for a second straight month, adding +78,600 jobs in December which nearly matched the previous month’s employment gain of +79,500. This marked the best two-month performance in Canada’s labour market since April 2012. Their participation rate is 65.8%.
In China, their securities regulator has placed a cap on the pay of bond traders. They now say annual salary and bonus from bond trading business for securities brokerage employees should not exceed 1 million yuan (NZ$215,000) and if there is anything above that it needs to be delayed and paid in two years.
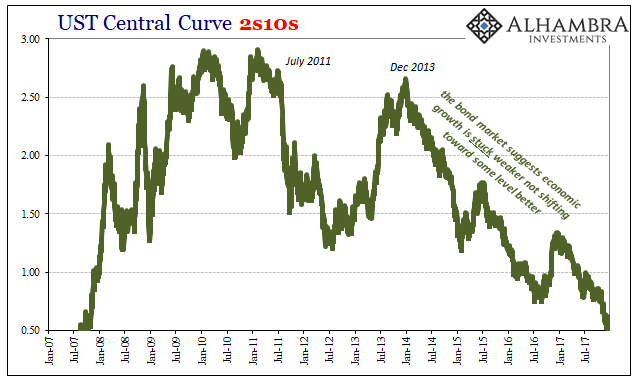
The UST 10yr yield is higher at 2.48% today (+3 bps). In China, the equivalent 10yr sovereign bond is yielding 3.94% (unchanged) while the equivalent NZ 10yr sovereign bond is yielding 2.76% (-1 bp). We should also note that the US 2-10 yield curve is now just +50 bps and its lowest in more than a decade.
Further, corporate credit risk indications via CDS spreads are now almost back to their 2007 levels. In fact, Australasian corporate CDS spreads are now at their lowest since 2007 (and probably their lowest ever).
Oil prices are lower by -US$0.50 in the US today with the WTI benchmark now just under US$61.50 a barrel, while the Brent benchmark is just under US$67.50.
Gold is up another +US$3 to US$1,321/oz.
This morning the Kiwi dollar is firmer this morning at just on 71.7 USc, and on the cross rates it is at 91.2 AUc, and against the euro it's also higher at 59.5 euro cents. That puts the TWI-5 at 73.9 and its highest since when Winston Peters anointed Jacinda Ardern.
Bitcoin has had a major boost overnight, and is up US$1,600 to US$16,434 US$14,823 or +10.8% on the day.

The easiest place to stay up with event risk today is by following our Economic Calendar here ».
Daily exchange rates
Select chart tabs
7 Comments
Equity markets have pretty much ignored the data with the S&P500 up +0.5% on the day, but the US dollar has retreated and bond prices fell.
Hmmmm....
Today, following the traditional 5 year delay, the Fed published the full transcripts of every conference and meeting held in 2012. This gave us the opportunity to, among other thing, peer inside the minds of then-chair Ben Bernanke, Janet Yellen, various Fed governors and presidents, as to how they approached QE3 in particular, and monetary policy in general in what was a critical period for US capital markets.
What emerges is that, as many had suspected, QE3 was just the Fed's latest - technically third - major attempt to prop up the US "wealth effect", which by definition required pushing equities higher, even if - as we have repeatedly shown - only a modest fraction of the US population is actively invested in the stock market. Read more
technically the third major attempt to prop up the US "wealth effect"
Factually there were 5 shots all up, 2 in addition to the 3 QE programs
Prior to QE there was Helicopter Money Drop followed by TARP
And, if I recall correctly QEIII comprised 12 installments
We should also note that the US 2-10 yield curve is now just +50 bps and its lowest in more than a decade.
The December 2017 payroll report really hit the trifecta of awful – bad month, bad year, bad decade. But if you never get past seeing the month, or the year, as anything but good to awesome, you can only ever be confused about what’s happening and why. The economic problem is a big one, one that doesn’t easily fit into something like Payroll Fridays. That’s surely the main reason for a lot of this; it’s almost too much to grasp, and for most people accustomed to only economic growth it is an assault on basic modern assumptions.
As I wrote yesterday, one of those assumptions is that any period of stagnation or malaise has to end. In truth, there is nothing anywhere that says that it does; depression can go on for as long as whatever caused it remains a relevant condition or factor. That’s really the point of this exercise, indeed looking at any data objectively. We need to identify whether or not something has actually changed before we can ever begin to think about its possible transition to something appreciably better.
A seriously decelerating labor market dropping down to 1.3% calendar year growth is alarming beyond the longer-term, baseline question, and therefore doesn’t even begin to suggest a breakout to a non-depressed condition. That’s doubly true for a year, 2017, that was supposed to be the very opposite, the inarguable start of acceleration toward those better days. Read more
When the Last Bear turns into a Bull ( of sorts!)........
"A melt-up or end-phase of a bubble within the next 6 months to 2 years is likely, i.e.,
over 50%."
Jeremy Grantham.
https://tinyurl.com/ycsefja5
Common knowledge the US sharemarket at historic heights
Technical analysis showing the similar wave patterns to 1929
Add in a moron POTUS & potential for war in Nth Korea along with US corporate taxcuts
and you either have the end of the golden run or the commencement of another great year 2018
If Trump goes Pence will replace & markets will be very happy
FED is treading very lightly and will not risk triggering a market downturn so really regardless of all the negatives the positives still look good.
Perhaps therein lays the answer If it looks too good it’s probably not
At any rate dividends will prove excellent
If the markets do implode they’ll be some great buying opportunities for those with cash Just hope the banks don’t give us a haircut
Listening to the Chatter around the traps
I pay attention when academics get out and about and actually do research - rarely see NZ academics showing their heads above the ramparts - only one of any note is Dr Bryce Edwards of Otago University (political commentaries) followed by Professor Paul Spoonley of Massey (social opinions)
UNSW modelling shows Housing supply alone won't fix the affordability crisis
"Analysis by Australian National University academics Phillips and Joseph has identified a long-term oversupply of housing in many inner Sydney suburbs."
https://www.brisbanetimes.com.au/business/the-economy/housing-supply-al…
Why the government can’t supply its way to housing affordability
One of the better behavioural analysis
In a recent University paper, UNSW academics Phillips and Joseph found supply levels from 2001 to 2017 were more than necessary to cover demand requirements, with thousands of excess homes in Sydney, yet prices boomed over the time period
https://www.brisbanetimes.com.au/business/the-economy/housing-economics…
Another inscrutable developer who didn't understand common law
Developer can't retract $5.8 million offer for Auckland lifestyle block, judge rules
https://www.stuff.co.nz/business/property/100347597/developer-cant-retr…
Reminiscent of Cornwall Park leaseholder who didn't understand Glasgow Leases
Cornwall Park leaseholder liable for $173,000 back rent - Court
http://www.nzherald.co.nz/business/news/article.cfm?c_id=3&objectid=116…
The Court of Appeal yesterday found that Yong Xin Chen, who abandoned her house on Maungakiekie Ave in the Auckland suburb of One Tree Hill, was liable for almost $175,000 in back rent. Chen also failed to challenge the nearly $120,000 bill she was ordered to pay by the High Court for the cost of repairs done to her property after she left. Total $295,000
What's the real issue and how do we solve it?
No longer a demand for homes but the greed fuelled demand for more false wealth. A symptom of the limited supply of real wealth to convert into money and stuff. An illusion of scarcity is required to maintain ever increasing prices of the necessities. A false narrative is required to continue fooling the masses and keep them believing in the economic growth, monetary wealth construct.
We have an inherent fallibility in humanity that instead of understanding we continue to exploit to prop up our false concept of wealth and prosperity.
We welcome your comments below. If you are not already registered, please register to comment
Remember we welcome robust, respectful and insightful debate. We don't welcome abusive or defamatory comments and will de-register those repeatedly making such comments. Our current comment policy is here.