

Here's my Top 10 picks for leading indicators to watch in 2014, including links to useful articles about said picks. As always, we welcome your additions in the comments below or via email to bernard.hickey@interest.co.nz.
See all previous Top 10s here.
My must read today is #2 on the Chinese shadow banking situation.

1. Chinese dairy production - China Business News has reported that in 2013 China reduced its dairy herd by 2 million cows because drought-hit farmers there were hit by high feed costs and took advantage of high beef prices to slaughter cattle.
That is forcing China to import more milk powder from the likes of New Zealand.
Remember New Zealand has less than 7 million cows and China sources more than half its imports from New Zealand. No wonder, despite record high production here and production ramping up in America, there are very high dairy prices. Prices remained elevated at last week's GlobalDairyTrade auction.
People rightly focus on our own production outlook and the prices we get fortnightly, but we should also keep an eye on Chinese production, given New Zealand (despite the botulism scare) is the major supplier of dairy imports to China.
Any continued fall in Chinese production would of course be great for dairy prices, and our economy.
There is a downside though if our terms of trade remain as high as they've been in the last six months.
The Reserve Bank included in its December quarter monetary policy statement a 'Box C' (page 43) scenario, which shows that a higher Terms of Trade would force the Reserve Bank to increase the Official Cash Rate by more like 2.5% than the 2.25% currently forecast.
2. Shibor - Central bankers and professional worriers like me are very focused on China's shadow banking system and whether it might trip up the Chinese economy.
I'm not so sure any hiccup inside China's financial system will cause much grief for us, given demand for dairy and meat is more closely connected to consumers, who have plenty of savings, rather than developers and local governments. It may hit the Australians, via iron ore and coal prices, more than us. The Chinese also have a track record of intervening to ensure the growth keeps chugging along over 7%, including by forcing 'rollovers' of loans, intervening to keep its currency low and simply cranking up investment with yet more debt.
But it is certainly something to watch.
The canary in the mine of China's internal debt problem is is the Shanghai Interbank borrowing rate (Shibor), which is a reflection of what banks have to pay each other for short term loans.
Shibor leapt in June and again in December as stress in China's banking system spilled over into higher rates. The Peoples Bank of China has tried a couple of times now to let the market deal with these stresses and both times it has blinked.
Here's Beijing based economist Patrick Chovanec explaining via Bloomberg why it's worth watching:
To those who wrote off China’s first banking seizure in June as a fluke, this latest episode appeared to come out of nowhere. They cast about for explanations: Perhaps some seasonal surge in cash withdrawals was to blame, or the U.S. Federal Reserve’s decision to taper its bond-buying policy. Optimists assumed the PBOC was tightening credit on purpose, as a warning to banks to rein in unsafe lending practices. With inflation at manageable levels, they reasoned, the People’s Bank of China had plenty of room to loosen monetary policy again and ease the cash crunch.
In fact, loose monetary policy is the problem, not the solution. Two simple words -- bad debt -- are the key to understanding why China has too much money, yet not enough. In the years since the global financial crisis, China has racked up impressive growth in gross domestic product by engineering an investment boom, fueled by a surge in easy credit. Total debt has risen sharply, from 125 percent of GDP in 2008 to 215 percent in 2012. Credit has spiraled to $24 trillion from $9 trillion at the end of 2008. That’s an additional $15 trillion - - the size of the entire U.S. commercial banking sector -- lent out in just five years.
A lot of that money has gone into projects whose purpose was to inflate the country’s economic statistics, not to generate a return. Officially, China’s banks report a nonperforming loan ratio of less than 1 percent. In reality, they are rolling over huge amounts of bad debt, both on their own books and by repackaging it into retail investment products -- many of them extremely short-term -- that promise ever higher rates of return.
China’s banks can hide bad debt by playing this shell game, yet that doesn’t change the fact that they’re not getting their money back. With their capital locked up in existing projects, the only way they can finance the next round of big investments -- and keep China’s GDP growth rates from collapsing -- is by expanding credit. More and more of that new credit is now eaten up paying imaginary returns on the growing pile of bad debt.

3. Auckland building consents - This 2014 year is the first full year of the Housing Accord and the Government's last chance before the election to prove its efforts to boost housing supply are getting some traction. The Accord targets the issuance 9,000 consents in 2014, which would be 50% up on the number consented in 2013.
It's a huge ask, but if successful could reassure the Reserve Bank and reduce the size of interest rate hikes through 2015. It could take some of the steam out of house prices. It can't come soon enough. QV reported yesterday that Auckland values rose 15% in 2013 and were up 10% nationally.
This October speech from RBNZ Deputy Governor Grant Spencer explains the issues and the bank's outlook nicely.

4. Colin Craig's poll ratings and his electorate choice/deal - This seems a bit of a strange one to introduce into a 'year ahead' look at economics and business.
But this November's election is shaping up as a cliff hanger that will be decided by whether National can manage to help (or create) enough partners to stay in power.
Colin Craig's Conservative party is the main candidate and if National can gift him an Auckland electorate and get him elected it could stay in power.
That will then decide whether or not there is a capital gains tax and a multitude of other economic changes, including changes (perhaps) to the Reserve Bank Act.
In your view, is real estate a wise investment?
I don't think our preoccupation with property is healthy, but I understand why we do it in this country. We have quite a dysfunctional market in Auckland in that property prices are not reflective of reality: we have a bubble. They look at it and think "I can get an above-average return in property" - and it's true, which is annoying. In terms of investment, to have property outperforming business investments is a negative. We would be better served if it was directed elsewhere.
5. European deflation - Economists here in New Zealand may be fretting up a storm about future inflation and calling on the Reserve Bank to act now to avoid an inflation blowout, but in Europe and America there is real fear about the dangers of entering a vicious deflationary cycle.
Europe has been teetering on the brink of Japanese-style deflation in recent months, forcing many to consider whether the European Central Bank should start printing money US-Japan-UK-style.
The Germans want this verboten, but it's still an open question. If Europe does go into deflation and the ECB doesn't print, then we could be in for all sorts of ugliness.
We will also import some of that deflation in the form of much cheaper European products and cars in particular.
Here's Ambrose Evans Pritchard with his always entertaining view:
Core inflation – stripping out food and energy – fell to 0.7pc, lower than at any time following the Lehman crisis.
“It's lower than when the European Central Bank was forced to cut rates in November,” said David Owen from Jefferies Fixed Income. “A large number of countries across the periphery are either in deflation already or very close, and this is spreading to France. The ECB will have to do quantitative easing in the end,” he said.
Almost 25pc of the items in the price basket have dropped over the last year, the clearest evidence to date that the deflation ‘virus’ is becoming lodged in the system.
Mike Amey from the bond fund Pimco said the eurozone is “sleepwalking into a decades-long deflation trap” like the Japanese in the 1990s when they mistook near zero rates for easy money. The region has no margin for error as its ageing crisis takes hold.
While gentle deflation can be benign in low-debt economies, it plays havoc with the debt dynamics of leveraged economies, an effect described by US economist Irving Fisher in his 1933 classic “Debt-deflation Theory of Great Depressions”.
6. The NZ$/A$ cross rate - Some including HSBC Economist Paul 'Rockstar' Bloxham are predicting the New Zealand dollar could hit A$1.00 later this year, triggering a parity party.
If there is a party it needs to be in Australia because everything will be relatively cheaper there. I suggest the party be held at Paul Bloxham's place...
The theory goes that Australia's economy is slowing, or at least slower than it was and slower than ours. Our interest rates will be rising this year while Australia's are flat to falling.
This in part is due to the likely switch in the structure of the Chinese economy, away from investing in infrastructure (which requires iron ore and coal) and towards more consumption (which requires meat and milk). The third plenum decisions late last year appear to reinforce that trend, which would be relatively good news for New Zealand and less-good for Australia.
We'll see. The Chinese have failed in the last five years to wean themselves off the sugar rush of debt-fueled investment spending. Every time they've tried their economy has slowed and the leadership has unleashed the beast of more concrete and steel to keep things cooking. But as the chart above shows, that simply puts off dealing with the problem of leverage.
If the NZ$ does keep strengthening against the Australian dollar then it makes us less attractive to Australian tourists and will hamper (at best) our manufacturing exporters, who are more exposed to Australia than anywhere else.
7. Road usage - I love the ANZ's truckometer measures of light and heavy vehicle usage as a proxy and leading indicator for economic growth.
But something funny is happening with our usage of roads and attitudes to cars.
This chart from the Ministry of Transport shows kilometres travelled per capita per year (VKT) has been dropping since 2005. This is a global phenomena that is puzzling people. It seems young people don't want to spend much time (or money) on cars. They prefer their electronic devices and public transport. Ageing populations are also driving this (sorry for the pun).
It begs the question: why are we spending so much money on new motorways?
Here's more on this from the Guardian on the trend also being seen in America.
New car purchases by those aged 18-34 dropped by 30% in the US between 2007 and 2012, according to the car shopping website Edmunds.com. Many American under-35s are now not even getting their licence. Given that so called "millennials" – those born between 1983 and 2000 – are now the largest generation in the US, the trend is worrying car firms.
Meanwhile the number of miles driven by Americans each year has also started to drop –they now drive fewer miles per capita than at the end of Bill Clinton's first term, according to a report released last year by US PIRG Education Fund. And the age group showing the biggest decline? Those aged 16 to 34, who drove 23% fewer miles on average in 2009 than in 2001.
There are two main, and not necessarily mutually exclusive theories, for why America's millennials are eschewing cars, said Tom Libby, lead analyst for IHS Automotive. "One theory is that millennials have lost interest in cars in general. They live more of their lives online and just don't have the same innate interest in car ownership," he said. "Secondly, the economy has held them back and they'll return once it picks up enough."

8. Readymix concrete - This is one of my favourite chart series on Interest.co.nz. It shows readymixed concrete deliveries and is a very hard (pun intended) leading indicator of construction activity.
It is really ramping up.
Readymix concrete
Select chart tabs
9. Log exports to China - We are all conditioned to think now that the big story of trade and the economy at the moment is milk powder exports to China. It is true this shift is huge.
But we shouldn't forget the equally epic shift towards log exports to China. Not only has China appeared out of nowhere as a buyer of our log exports, but has driven a massive increase in exports of logs vs more processed wood exports.
Here's an excellent Statistics NZ graphic showing the shift since 1992.

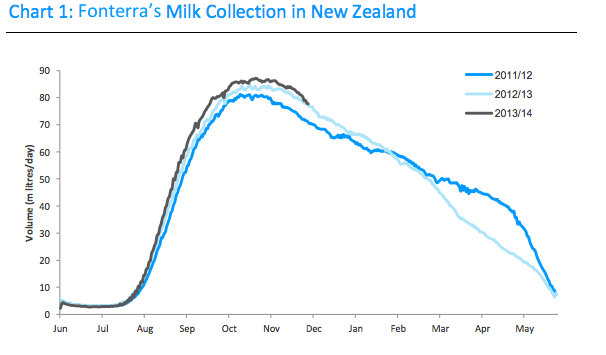
10. Fonterra milk production - Just to finish off with a similarly milky flavour, the last leading indicator to watch is New Zealand's milk production.
Fonterra produces a regular update of how it's 'milk curve' is tracking and how much it expects total production to be for the year. It's current forecast is for a 6.4% increase on last year, which was hit hard by the drought.
The chart says it all.
We welcome your comments below. If you are not already registered, please register to comment
Remember we welcome robust, respectful and insightful debate. We don't welcome abusive or defamatory comments and will de-register those repeatedly making such comments. Our current comment policy is here.