"Don't tell me what you value. Show me your budget, and I'll tell you what you value." - Joe Biden
This table outlines the New Zealand Government's planned tax collections for the 2026/27 budget year.
Actual tax collected for the previous four years is on the left for the sake of comparison.
The numbers are drawn together from data released by the Minister of Finance on May 28, 2026.
Links to the primary sources used, from Treasury's website, can be found at the bottom of this page.
Figures for each allocation are in millions of NZ$
| Actual 2021/22 |
Actual 2022/23 |
Actual 2023/24 |
Actual 2024/25 | Estimate 2025/26 | Budget 2026/27 | ||
| NZ$m | NZ$m | NZ$m | NZ$m | NZ$m | NZ$m | % | |
| 0.0 | 79.2 | 0.0 | 0.0 | 0.0 | Environmental Restoration Accounts Scheme | 0.0 | 0.0% |
| 362.3 | 110.2 | 94.6 | 32.8 | 12.5 | Small Business Cashflow Scheme interest unwind | 0.0 | 0.0% |
| 194.8 | 139.8 | 24.6 | 21.6 | 20.0 | Child Support Collections | 0.0 | 0.0% |
| 50.4 | 172.3 | 112.8 | 57.6 | 58.0 | Unclaimed Monies | 0.0 | 0.0% |
| 23.7 | 27.1 | 32.0 | 34.1 | 31.0 | Working for Families Tax Credit Interest and Penalties | 0.0 | 0.0% |
| 122.1 | 249.2 | 131.5 | 49.9 | 115.0 | Income Equalisation Reserve Account | 0.1 | 0.1% |
| 18.6 | 31.5 | 76.9 | 86.8 | 80.0 | Other non-tax revenue | 0.1 | 0.0% |
| 122.6 | 431.5 | 379.8 | 334.1 | 166.7 | Small Business Cashflow Scheme receipts | 0.1 | 0.1% |
| 97.5 | 153.2 | 198.3 | 231.4 | 219.0 | Other Indirect Taxes | 0.2 | 0.1% |
| 272.5 | 342.1 | 350.0 | 398.1 | 423.0 | Gaming Duties | 0.4 | 0.3% |
| 317.6 | 606.0 | 661.6 | 518.4 | 342.0 | Interest on Impaired Student Loans | 0.4 | 0.3% |
| 684.4 | 768.8 | 837.9 | 908.9 | 959.0 | Fringe Benefit Tax | 1.0 | 0.6% |
| 1,604.7 | 1,633.5 | 1,596.5 | 1,562.7 | 1,642.0 | Student Loans - Receipts | 1.7 | 1.1% |
| 3,756.6 | 5,367.5 | 5,831.7 | 6,242.6 | 5,204.8 | Finance | 4.6 | 3.0% |
| 2,465.6 | 3,840.8 | 6,701.0 | 5,240.3 | 4,473.0 | Withholding Taxes | 4.3 | 2.8% |
| 9,380.4 | 7,721.9 | 7,210.8 | 8,479.8 | 8,295.0 | Other Persons | 9.0 | 5.9% |
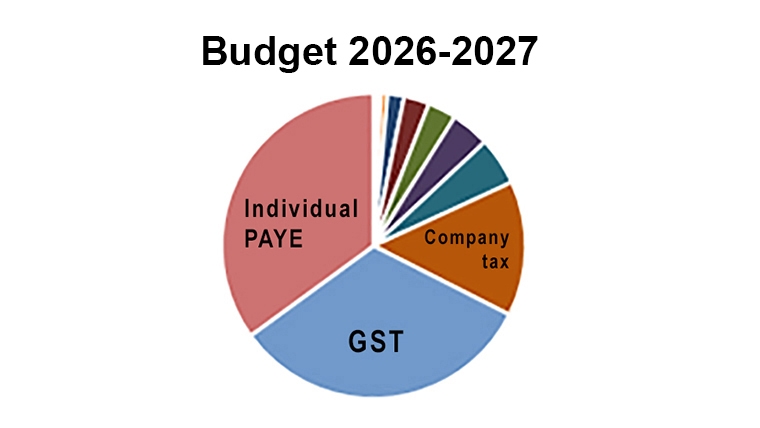
| 19,862.3 | 17,988.5 | 17,999.4 | 19,004.0 | 18,943.0 | Companies | 21.3 | 13.9% |
| 17,511.8 | 18,565.2 | 17,410.6 | 17,764.3 | 18,249.9 | Customs | 19.2 | 12.5% |
| 24,690.6 | 25,880.1 | 29,246.7 | 29,250.4 | 30,679.0 | GST | 32.2 | 21.0% |
| 43,145.8 | 47,789.2 | 52,863.5 | 53,076.1 | 55,282.0 | PAYE deductions | 58.4 | 38.1% |
| 124,684 | 131,818 | 141,760 | 143,294 | 145,195 | Grand Total | 153,119 | 100% |
| 365.3 | 401.8 | 420.9 | 435.0 | 454.2 | GDP (nominal, per RBNZ) | 485.6 | |
| 34.1% | 32.8% | 33.7% | 32.9% | 32.0% | Govt taxation - % of GDP | 31.5% | |
| and this compares with taxes collected as follows: | |||||||
| 154,111 | 154,562 | 165,256 | 165,893 | 176,303 | Total Expenditure | 184,179 | |
Sources: You can download the data behind these tables from the Treasury website here.
1 Comments
Far too much of the tax heavy lifting is done by individuals and not companies.
Ironic given the nature of our economy, ie lack of competition and a small market leading to excess profits by companies in some sectors. ie banking, supermarkets, power companies etc.
How much tax do google and Amazon pay in NZ?
We welcome your comments below. If you are not already registered, please register to comment
Remember we welcome robust, respectful and insightful debate. We don't welcome abusive or defamatory comments and will de-register those repeatedly making such comments. Our current comment policy is here.