
Updated with 2022 data.
By David Chaston
"Urban sprawl" is a term that has entered the vocabulary and has come to be used as an epithet.
That seems slightly odd as we are choosing to live in towns and cities in a world-leading way. There is no 'escape to the country' going on in New Zealand, more like an 'escape from the country'.
New Zealand is now 88% urban, having moved from about 60% rural a century ago.
In fact, we have one of the most urbanised concentrations on the planet. 68%+ of our total population lives in just 18 main urban centres, and 60%+ live in the seven centres of 100,000 or more (and that now counts Napier/Hastings as one of them with less than eight kilometres now separating them - 20kms centre-to-centre).
As the main centres have grown, many smaller ones have shrunk.
But the growth of the main centres worries many people. Is it justified?
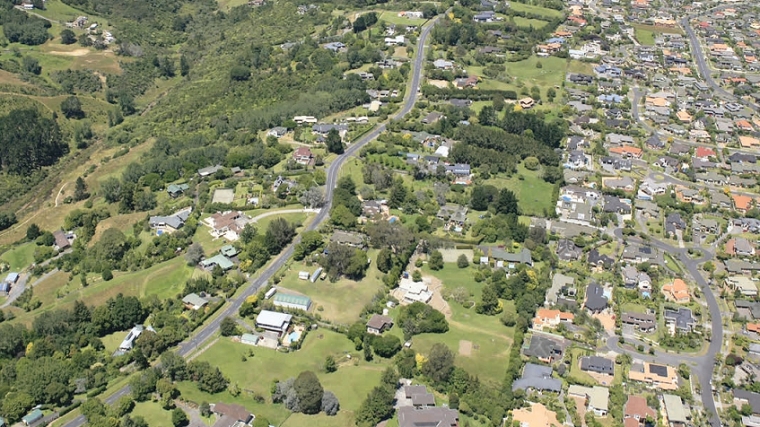
One way to assess this growth (and "sprawl") is to visualise it over time.
That shows impressive change, but it also shows that city encroachment is actually quite minor from a national perspective and localised.
We have commissioned a series of visualisations from OpenGeo that show this for seven centres. These visualisations are based on the registering of titles at the house-lot size. The recording starts in 1870 almost 150 years ago so the span of urbanisation history is revealed here.
Each will run on this page, but you can also click the
Feedback in the comment section below is encouraged.
Auckland
Hamilton
Tauranga
Palmerston North
Wellington
Christchurch
Dunedin
These visualisations were developed by OpenGeo - http://opengeo.co.nz
18 Comments
Awesome visualisations, very well done David, thanks so much
Paul Hughes at OpenGeo is who deserves the credit.
Outstanding effort. My family have been in Auckland for 170 years and it gives a real sense of what density there was during the early years.
Ditto! Except it was Dunedin...
https://en.wikipedia.org/wiki/Johnny_Jones_(pioneer)
Up the Urban Planners!
It does not matter how many people you can cram into urban areas, you still need approximately 5.5 acres of arable land each somewhere to provide for them.
More like 1.75 acres Pockets, the world has changed without you noticing. "At the global level, per capita agricultural land use is now less than half its value in 1961."
https://ourworldindata.org/grapher/agricultural-area-per-capita?country…
Cram? 1.9% of NZ land is urbanised. Oh the humanity.
http://www.stats.govt.nz/browse_for_stats/Maps_and_geography/Geographic…
Gosh then maybe we don't have to displace other species and strip the oceans bare after all, so why the hell are we? I think your 1.75 is far too tight, that allows no room for land being unable to be used due to weather, in any one year, or rotated such as must be done for most crops at the sort of population numbers we have now.
Hardly accurate, when the picture cuts off half of Auckland.
What could be a powerful tool for demonstrating the extent of sprawl, instead feeds a false narrative. The 1990-2000s expansion across the East Tamaki, is shown gobbling up land. But then in 2010s everything sort of slows as if the Council is now creating a compact city. Total BS.
This Auckland visual does not show all of Auckland. Off camera the Beachlands, Orewa, Warkworth, Kaukapaka, Helensville, Wellsford, Pukekohe, etc. sprawl bursts outwards post 2010, A more rapid expansion than anything previous is occurring today. Not shown.
Any chance you could point out to OpenGeo that Franklin - particularly Pukekohe - is within Auckland Boundaries - noting that the RUB has been rubbished under Auckland Council. Growth is ludicrous!
the earliest growth must have been where the ferries went..??
Harbour bridge was completed in 1959... ka pow... growth explodes on that side.
First section of north western M/way was built in 1952.... extended out to massey in 1957.
Out west seemed to only become really popular in the late 60s' into 1970s..?
Great images.
Well done!
TTP
Did you pause at 1909 for Palmerston North and reminisce the good times growing up?
Christchurch's shape is changing from a small apple to a fat banana. This has important implications for land-use planning and infrastructure provision.
https://medium.com/land-buildings-identity-and-values/greater-christchu…
its amazing the lack of long term planning for all cities and towns, how many even have a 50 or hundred year plan, most would be 10 year at best with our level of people growth are out of date after 5.
the other is the lack of kahunas to do something big in case you are not relected and kicking the can down the road.
Quite surprised at how much consistent activity there is on the Wellington image. I thought it would have a reached a stable state fairly early and stayed there, as the map excludes the post WW2 growth exurbs of the Hutt Valley and Porirua,
These visualisations have now been updated to 2018.
Really cool timelapses. It is interesting to ponder what Auckland will look like in a few generations. I expect a lot more densely populated judging by the amount of subdivisions Auckland seems to churn out.. Especially now that first-time "mum and dad" developers are getting in on the action and chopping off the back of their sections (https://www.subdividesimplified.co.nz/auckland-subdivisions). Seems like it's easier to be a "property developer" these days..
We welcome your comments below. If you are not already registered, please register to comment
Remember we welcome robust, respectful and insightful debate. We don't welcome abusive or defamatory comments and will de-register those repeatedly making such comments. Our current comment policy is here.