

Rental yields and cash flows on residential investment properties both improved in the first quarter of this year, but remain at low levels in many parts of the country.
Interest.co.nz tracks indicative gross rental yields on three bedroom houses and one and two bedroom apartments/units in most major urban areas throughout the country, based on the Real Estate Institute of New Zealand's lower quartile selling prices for those types of properties in each district, and the median rent for those same types of properties in each district, based on rental bond data.
We also estimate how much of a cash surplus or deficit there would be after mortgage payments were deducted from the rental income. See the explanation of how this is calculated at the bottom of the table below.
This shows national indicative gross rental yields improved for all three property types in the first quarter (Q1) this year compared to the fourth quarter (Q4) last year, with indicative cash flows also improving.
The national yield on three bedroom houses increased from 5.6% in Q4 last year to 5.9% in Q1 this year. The yield on two bedroom units/apartments increased from 6.7% to 7.2%, and from 8.7% to 9.2% for one bedroom units/apartments.
The improvement in yields was driven by declines in the lower quartile selling prices of three bedroom houses and two bedroom units/apartments in Q1 this year, and increases of $15 to $20 a week in median rents for the same types of properties.
The cash flow situation also improved across the board, with the national figures showing free cash remaining from a three bedroom house after the mortgage was paid increasing from $74 a week in Q4 last year to $129 in Q1 this year. For two bedroom units/apartments it increased from $150 a week to $202, and for one bedroom units/apartments from $205 to $227.
The improvement in cash flows was driven by the small lift in median rents and the decline in mortgage interest rates, with the rate used in in these calculations declining from 5.61% in Q4 last year to 5.05% in Q1 this year.
So overall, the above figures suggest an improvement in the performance of residential investment properties in the first quarter of this year. The bad news is that the figures are still terrible.
The table below shows the indicative yield and cash flow figures for the three property types in all of the urban areas monitored by interest.co.nz.
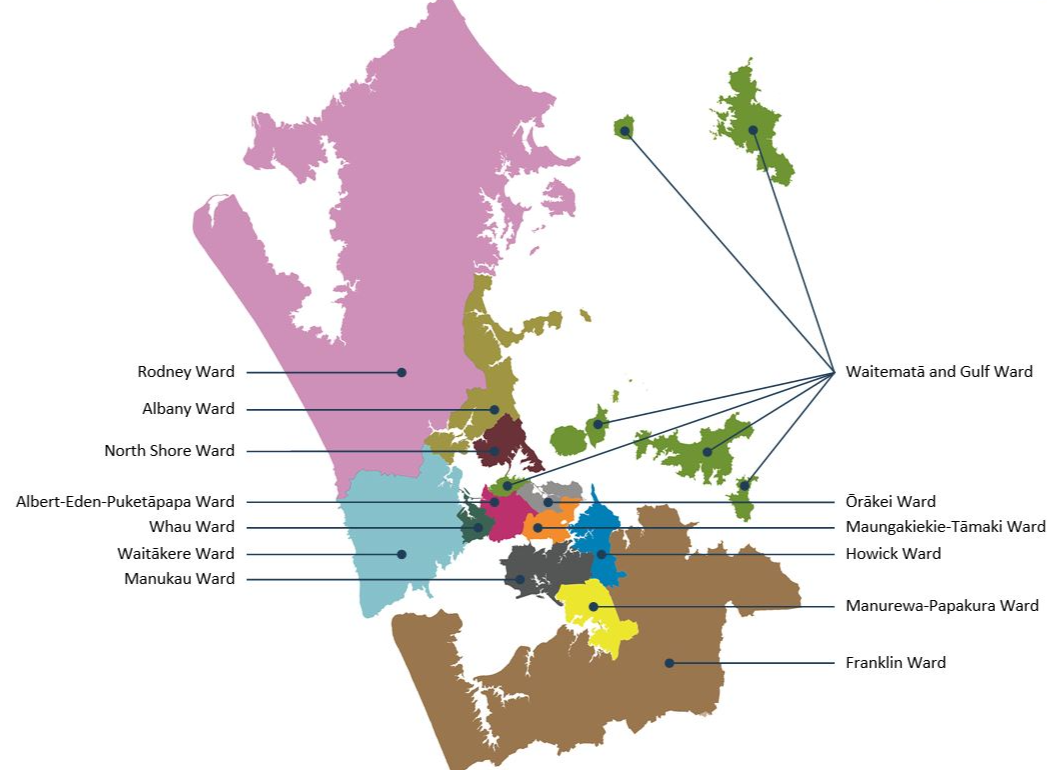
In Auckland, which is the country's largest rental market by far, with Tenancy Services receiving more than 16,000 tenancy bonds from Auckland in Q1 this year, the yields for three bedroom houses are under 5% in all but one of the council wards, and are under 4% in three of them.
Although indicative cash flows in Auckland improved between Q4 last year and Q1 this year, they remain in negative territory in all wards except Manukau where the free cash flow is just $1 a week after the mortgage is paid and $38 a week in Manurewa-Papakura.
Even in areas where the yield and cash flow figures are high, it should be remembered they are gross figures and take no account of outgoings such as rates, insurance, maintenance, management costs or periods of vacancy.
Once those costs are taken into account, it's likely that many more investment properties will be bleeding cash.
Underlying this problem is the fact much of the residential investment activity that has occurred over the last few years has been driven by the prospect of ever increasing capital gains.
Many investors were prepared to suffer short term cash losses in the expectation they could sell up for fat profits after a few years.
With capital gains now in short supply, many investors are now being caught between the rock of negative cash flow and the hard place of capital losses.
Although the Q1 figures showed some improvement in the situation, the outlook is mixed at best.
Any further cuts to interest rates will help cash flow, but rents are starting to look weaker due to an oversupply of properties, and that will likely also lead to higher and longer vacancy rates.
And no one is expecting outgoings such as rates, insurance and maintenance costs to get easier any time soon.
The comment stream on this story is now closed.
| Indicative Gross Residential Rental Yields & Gross Cash Surplus/Deficit After Mortgage Paid | ||||||
| Q1 2025 | ||||||
| 1 Bedroom Apartment/Unit | 2 Bedroom Apartment/Unit | 3 Bedroom House | ||||
| District | Yield* | Cash* | Yield* | Cash* | Yield* | Cash* |
| Whangarei District | 7.8% | $152 | 5.8% | $90 | 5.5% | $77 |
| Auckland Region | 10.1% | $258 | 5.6% | $87 | 4.5% | -$43 |
| Auckland Council Ward Areas: See map below for ward boundaries | ||||||
| Rodney Ward | N/A | N/A | 4.1% | -$108 | ||
| Albany Ward | 5.0% | $27 | 4.7% | -$3 | 4.2% | -$107 |
| North Shore Ward | 6.7% | $164 | 4.5% | -$32 | 4.0% | -$141 |
| Waitakere Ward | 5.3% | $44 | 5.5% | $74 | 4.3% | -$72 |
| Waitemata and Gulf Ward | 21.6% | $358 | 10.0% | $314 | 3.3% | -$413 |
| Whau Ward | 7.1% | $147 | 5.4% | $62 | 4.1% | -$120 |
| Albert-Eden-Puketapapa Ward | 6.7% | $150 | 5.1% | $37 | 3.5% | -$259 |
| Orakei Ward | 6.5% | $155 | 5.1% | $40 | 3.3% | -$388 |
| Maungakiekie-Tamaki Ward | 7.3% | $211 | 5.3% | $70 | 4.2% | -$90 |
| Howick Ward | 5.6% | $71 | 5.2% | $45 | 4.0% | -$143 |
| Manukau Ward | 5.5% | $59 | 6.6% | $165 | 4.8% | $1 |
| Manurewa-Papakura Ward | N/A | 3.7% | -$124 | 5.1% | $38 | |
| Franklin Ward | 5.6% | $63 | N/A | 4.6% | -$19 | |
| Hamilton City | 8.4% | $147 | 5.7% | $79 | 5.0% | $33 |
| Taupo District | N/A | 5.2% | $36 | 5.2% | $55 | |
| Tauranga City | 4.4% | -$32 | 4.9% | $17 | 5.1% | $46 |
| Rotorua District | 11.8% | $256 | 10.6% | $310 | 6.1% | $136 |
| Whakatane District | N/A | N/A | 5.7% | $105 | ||
| Hastings District | N/A | 5.9% | $100 | 6.5% | $178 | |
| Napier City | 6.7% | $149 | 6.3% | $133 | 5.6% | $104 |
| New Plymouth District | 12.3% | $295 | 5.8% | $80 | 5.7% | $102 |
| Whanganui District | N/A | 8.8% | $252 | 7.1% | $179 | |
| Palmerston North City | N/A | 5.9% | $87 | 5.9% | $115 | |
| Kapiti Coast District | N/A | N/A | 4.9% | $16 | ||
| Porirua City | N/A | N/A | 5.2% | $54 | ||
| Upper Hutt City | N/A | N/A | 5.3% | $66 | ||
| Lower Hutt City | 9.6% | $247 | 6.6% | $167 | 5.5% | $98 |
| Wellington City | 6.7% | $142 | 6.9% | $200 | 4.9% | $27 |
| Nelson City | 5.5% | $56 | 5.7% | $86 | 5.4% | $78 |
| Marlborough District | N/A | N/A | 5.4% | $73 | ||
| Waimakariri District | N/A | N/A | 5.0% | $33 | ||
| Christchurch City | 6.2% | $98 | 6.2% | $117 | 5.3% | $60 |
| Selwyn District | N/A | N/A | 4.7% | -$13 | ||
| Ashburton District | N/A | N/A | 5.5% | $63 | ||
| Timaru District | N/A | N/A | 5.7% | $87 | ||
| Queenstown-Lakes District | 7.9% | $197 | 5.5% | $102 | 4.3% | -$91 |
| Dunedin City | 7.3% | $143 | 6.8% | $144 | 6.1% | $134 |
| Invercargill City | N/A | N/A | 6.8% | $159 | ||
| Total New Zealand | 9.2% | $227 | 7.2% | $202 | 5.9% | $129 |
| Notes:* The Gross Rental Yield is based on purchasing a property at the REINZ's lower quartile selling price for each type of property in each district, and the median rent for the same types of properties in the same district sourced from Tenancy Services' bond data. Gross cash surplus/deficit is the amount of rental income remaining after the mortgage has been paid. This assumes the property was purchased with a 40% deposit, with the mortgage payments calculated using interest rates of 5.05%, for a 20 year term. Both the yield and cash flow figures make no allowances for periods of vacancy, or outgoings such as rates, insurance or repairs and maintenance. Property details are marked N/A (not available) when there were too few of the particular type of property sold and/or rented during the quarter to produce reliable data. | ||||||
Auckland Council Ward Areas

12 Comments
Speculation without support from income is gambling. As the tide retreats on price negative leverage kicks in.
🍿
Without capital gains it makes no sense. Those who purchased pre-COVID will be fine, the rest is history.
OMG interest just said the quiet thing out loud……. Without CG current prices are not based on real cash flows
Even the Painter agreed it was a casino. The Casino (I mean Bank) always wins.
Also there will be a lag on when borrowers can get onto the lower interest rates as fixed loans are likely to be still on higher rates.
LVR ratios are quite constraining when the 'V' part of the equation is decreasing in price
I wonder if the distorted numbers in Auckland's CBD are due to leaseholds being considered in the mix, without accounting for the land lease costs?
It's easy to improve your yield, just accept the true value if your property is alot less.
It is also about time the yield was calculated as per commercial, ie net, rather than Gross.
One bedrooms show a higher return but this not only has to cover the higher risk, but also higher relative opex costs, so the net us probably less than the other types.
In stable housing markets, the price if comparable housing is way more affordable, with capital growth only reflecting the general rate of inflation, or any true value added amenity you may have made, and thus higher yields are required, but since the initial price was that much more affordable, then the rents are still approx. 1/3 cheaper than here.
The future is about greater net. yields without increasing present rents.
It all points in a certain direction.
Important
".........It's easy to improve your yield, just accept the true value if your property is a lot less......,"
And the land lording business was always capital gain. That was then. This is now.
The new phrase is Capital Losses
Every asset bubble eventually comes to end when the debt taken on by the bubble participants can no longer be serviced by real world income.
We welcome your comments below. If you are not already registered, please register to comment
Remember we welcome robust, respectful and insightful debate. We don't welcome abusive or defamatory comments and will de-register those repeatedly making such comments. Our current comment policy is here.