Public Policy
/ analysis
Budget 2025/26 - Summary of all spending plans
24th May 25, 10:56am
by
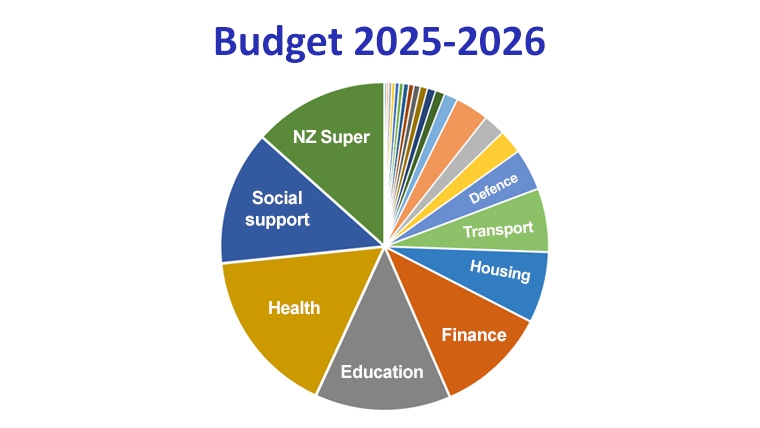
This table outlines the New Zealand Government's planned spending for the 2025/26 budget year.
Actual spending for the previous four years is on the left.
The numbers are drawn together from data released by the Minister of Finance on May 22, 2025.
Links to the primary sources used, from Treasury's website, can be found at the bottom of the page.
Click on any underlined heading to drill down to what makes up these numbers. Figures for each allocation are in millions of NZ$.
| Actual 2020/21 | Actual 2021/22 | Actual 2022/23 | Actual 2023/24 | Estimate 2024/25 | Budget 2025/26 | % | |
| NZ$m | NZ$m | NZ$m | NZ$m | NZ$m | NZ$m | ||
| 10.6 | 3.3 | 0.0 | 0.0 | 0.0 | Pike River Re-entry (old) | 0.0 | 0.0% |
| 8.6 | 10.1 | 10.2 | 10.8 | 14.0 | Women | 15.2 | 0.0% |
| 12.3 | 14.7 | 16.8 | 16.2 | 17.4 | Serious Fraud | 17.3 | 0.0% |
| 0.0 | 0.0 | 0.0 | 2.1 | 17.3 | Regulation | 18.2 | 0.0% |
| 22.0 | 23.4 | 25.6 | 26.3 | 30.2 | Office of the Clerk | 26.0 | 0.0% |
| 19.0 | 21.5 | 25.7 | 29.5 | 29.0 | Parliamentary Counsel | 28.6 | 0.0% |
| 0.0 | 0.0 | 0.0 | 0.0 | 14.2 | Social Investment | 40.7 | 0.0% |
| 27.1 | 32.5 | 45.4 | 47.9 | 55.8 | Ombudsmen | 56.1 | 0.0% |
| 62.2 | 65.4 | 70.3 | 72.1 | 91.5 | Public Service | 74.8 | 0.0% |
| 49.1 | 61.0 | 74.0 | 108.0 | 90.2 | Pacific Peoples | 82.9 | 0.0% |
| 95.2 | 91.4 | 101.7 | 111.2 | 117.0 | Security Intelligence | 111.9 | 0.1% |
| 212.9 | 146.6 | 153.6 | 163.0 | 125.5 | Sport and Recreation | 118.8 | 0.1% |
| 117.1 | 193.7 | 208.0 | 963.2 | 1,207.1 | Prime Minister and Cabinet | 130.9 | 0.1% |
| 887.3 | 914.0 | 210.4 | 198.5 | 145.0 | Building and Construction | 134.4 | 0.1% |
| 79.3 | 82.2 | 111.6 | 137.7 | 136.2 | Attorney-General | 135.9 | 0.1% |
| 188.7 | 149.6 | 153.0 | 126.6 | 188.2 | Forestry | 165.6 | 0.1% |
| 113.8 | 118.0 | 138.9 | 152.9 | 176.9 | Audit | 172.8 | 0.1% |
| 161.5 | 182.4 | 238.7 | 324.8 | 341.0 | Communications Security and Intelligence | 262.7 | 0.1% |
| 189.0 | 248.1 | 396.1 | 260.0 | 262.1 | Statistics | 268.4 | 0.2% |
| 177.5 | 168.5 | 208.7 | 227.9 | 328.7 | Parliamentary Service | 341.6 | 0.2% |
| 261.6 | 283.8 | 297.0 | 321.3 | 331.9 | Customs | 350.5 | 0.2% |
| 522.7 | 542.0 | 579.9 | 469.5 | 518.6 | Arts, Culture and Heritage | 403.2 | 0.2% |
| 406.2 | 288.7 | 161.8 | 156.8 | 439.4 | Tari Whakatau | 407.3 | 0.2% |
| 503.0 | 716.2 | 565.7 | 660.6 | 566.7 | Māori Development | 512.7 | 0.3% |
| 330.3 | 372.5 | 378.4 | 340.7 | 410.8 | Lands | 688.3 | 0.4% |
| 646.4 | 689.2 | 804.4 | 852.2 | 810.7 | Conservation | 811.5 | 0.5% |
| 700.8 | 588.6 | 817.6 | 845.1 | 868.2 | Justice | 1,003.9 | 0.6% |
| 1,112.7 | 1,093.7 | 1,390.6 | 1,472.3 | 1,169.9 | Internal Affairs | 1,109.9 | 0.6% |
| 896.0 | 889.2 | 1,113.5 | 1,078.9 | 1,338.1 | Agriculture, Biosecurity, Fisheries and Food Safety | 1,119.7 | 0.6% |
| 857.8 | 878.9 | 968.1 | 1,079.4 | 1,131.3 | Courts | 1,183.2 | 0.7% |
| 1,360.8 | 1,430.3 | 1,475.5 | 1,597.0 | 1,544.8 | Oranga Tamariki | 1,607.2 | 0.9% |
| 1,413.2 | 1,501.8 | 1,680.1 | 2,028.2 | 1,895.3 | Foreign Affairs | 1,797.1 | 1.0% |
| 0.0 | 0.0 | 0.0 | 0.0 | 10.6 | Disability Support Services | 2,790.1 | 1.6% |
| 1,219.3 | 1,220.2 | 1,220.0 | 1,220.1 | 1,220.3 | Environment | 2,848.9 | 1.6% |
| 2,328.3 | 2,180.8 | 2,259.9 | 2,513.6 | 2,893.7 | Corrections | 2,918.2 | 1.6% |
| 2,237.3 | 2,386.4 | 2,708.9 | 2,807.0 | 3,022.6 | Police | 3,176.2 | 1.8% |
| 2,429.2 | 2,651.8 | 2,865.5 | 3,088.8 | 3,254.5 | Labour Market | 3,473.0 | 2.0% |
| 4,626.2 | 3,392.4 | 3,351.6 | 3,454.8 | 3,742.4 | Business, Science and Innovation | 3,592.4 | 2.0% |
| 4,353.1 | 4,894.7 | 5,177.8 | 5,599.4 | 8,987.3 | Defence | 5,688.7 | 3.2% |
| 2,258.9 | 2,417.2 | 5,507.8 | 7,785.8 | 8,180.2 | Housing and Urban Development | 7,179.4 | 4.0% |
| 6,973.6 | 7,053.7 | 8,561.6 | 9,456.1 | 10,938.4 | Transport | 12,831.3 | 7.2% |
| 19,149.2 | 29,542.9 | 23,331.2 | 22,504.2 | 20,371.1 | Treasury & Finance | 19,541.8 | 11.0% |
| 17,397.5 | 19,681.9 | 20,424.4 | 22,757.1 | 23,396.9 | Education | 23,702.7 | 13.4% |
| 21,943.0 | 26,440.0 | 26,627.9 | 27,134.9 | 29,983.6 | Health | 31,052.2 | 17.5% |
| 33,625.9 | 39,501.8 | 39,223.5 | 42,467.1 | 45,642.8 | Social Development | 45,332.3 | 25.6% |
| 129,986 | 153,165 | 153,681 | 164,670 | 176,057 | Total Expenditure | 177,324 | 100% |
| 317,705 | 343,348 | 365,812 | 401,574 | 420,569 | GDP (nominal, per RBNZ) | 432,196 | |
| 36% | 36% | 36% | 35% | 34% | Govt spending as % of GDP | 34% | |
| and this compares with taxes collected as follows: | |||||||
| 114,331 | 124,684 | 131,818 | 141,760 | 142,127 | Total Revenue | 145,221 | |
The data in this table is net spending, after fee and charges revenues have been deducted from the gross expenditure planned.
Sources: You can download the data behind these tables from the NZ Government website here.
We welcome your comments below. If you are not already registered, please register to comment
Remember we welcome robust, respectful and insightful debate. We don't welcome abusive or defamatory comments and will de-register those repeatedly making such comments. Our current comment policy is here.