"Don't tell me what you value. Show me your budget, and I'll tell you what you value." - Joe Biden
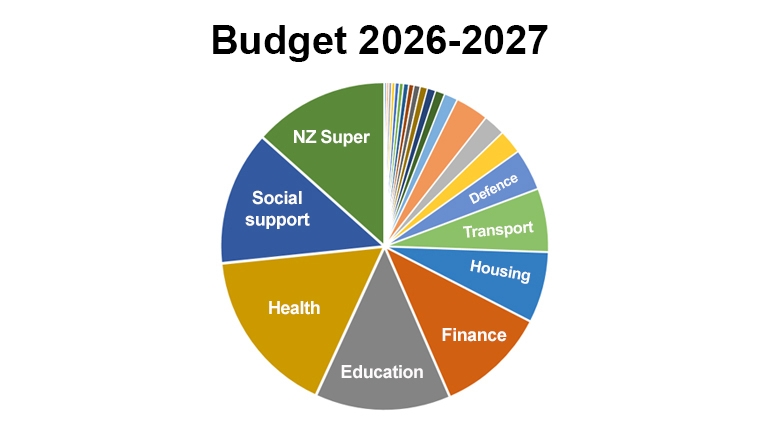
This table outlines the New Zealand Government's planned spending for the 2026/27 budget year.
Actual spending for the previous four years is on the left.
The numbers are drawn together from data released by the Minister of Finance on May 28, 2026.
Links to the primary sources used, from Treasury's website, can be found at the bottom of the page.
Click on any underlined heading to drill down to what makes up these numbers. Figures for each allocation are in millions of NZ$.
| Actual 2021/22 | Actual 2022/23 | Actual 2023/24 | Actual 2024/25 | Estimate 2025/26 | Budget 2026/27 | % | |
| NZ$m | NZ$m | NZ$m | NZ$m | NZ$m | NZ$m | % | |
| 0.0 | 0.0 | 0.0 | 0.0 | 0.0 | Pike River Re-entry (old) | 0.0 | 0.0% |
| 10.1 | 10.2 | 10.8 | 10.0 | 12.5 | Women | 14.7 | 0.0% |
| 14.7 | 16.8 | 16.2 | 16.6 | 17.4 | Serious Fraud | 17.4 | 0.0% |
| 0.0 | 0.0 | 2.1 | 16.6 | 18.5 | Regulation | 19.9 | 0.0% |
| 23.4 | 25.6 | 26.3 | 29.0 | 26.4 | Office of the Clerk | 31.0 | 0.0% |
| 21.5 | 25.7 | 29.5 | 27.4 | 30.2 | Parliamentary Counsel | 31.8 | 0.0% |
| 0.0 | 0.0 | 0.0 | 12.5 | 47.1 | Social Investment | 59.2 | 0.0% |
| 32.5 | 45.4 | 47.9 | 48.5 | 55.1 | Ombudsmen | 61.4 | 0.0% |
| 193.7 | 208.0 | 963.2 | 1,117.4 | 72.2 | Prime Minister and Cabinet | 64.9 | 0.0% |
| 61.0 | 74.0 | 108.0 | 84.5 | 52.9 | Pacific Peoples | 65.3 | 0.0% |
| 146.6 | 153.6 | 163.0 | 125.4 | 124.2 | Sport and Recreation | 116.8 | 0.1% |
| 914.0 | 210.4 | 198.5 | 130.8 | 142.3 | Building and Construction | 121.8 | 0.1% |
| 65.4 | 70.3 | 72.1 | 92.8 | 92.7 | Public Service | 131.5 | 0.1% |
| 82.2 | 111.6 | 137.7 | 129.2 | 553.8 | Attorney-General | 136.8 | 0.1% |
| 91.4 | 101.7 | 111.2 | 110.2 | 112.1 | Security Intelligence | 142.2 | 0.1% |
| 118.0 | 138.9 | 152.9 | 158.5 | 184.6 | Audit | 193.4 | 0.1% |
| 149.6 | 153.0 | 126.6 | 124.3 | 159.9 | Forestry | 199.7 | 0.1% |
| 168.5 | 208.7 | 227.9 | 267.7 | 396.9 | Parliamentary Service | 270.3 | 0.1% |
| 248.1 | 396.1 | 260.0 | 219.5 | 256.0 | Statistics | 274.7 | 0.1% |
| 182.4 | 238.7 | 324.8 | 287.6 | 249.6 | Communications Security and Intelligence | 344.2 | 0.2% |
| 283.8 | 297.0 | 321.3 | 287.9 | 341.3 | Customs | 362.9 | 0.2% |
| 288.7 | 161.8 | 156.8 | 133.2 | 394.0 | Tari Whakatau | 409.8 | 0.2% |
| 542.0 | 579.9 | 469.5 | 437.9 | 473.9 | Arts, Culture and Heritage | 460.8 | 0.3% |
| 716.2 | 565.7 | 660.6 | 557.5 | 518.8 | Māori Development | 484.6 | 0.3% |
| 0.0 | 0.0 | 0.0 | 0.0 | 0.0 | Cities, Environment, Regions, and Transport | 523.1 | 0.3% |
| 372.5 | 378.4 | 340.7 | 353.8 | 428.4 | Lands | 575.2 | 0.3% |
| 689.2 | 804.4 | 852.2 | 771.0 | 858.1 | Conservation | 799.7 | 0.4% |
| 588.6 | 817.6 | 845.1 | 843.7 | 1,038.1 | Justice | 1,088.6 | 0.6% |
| 1,093.7 | 1,390.6 | 1,472.3 | 1,066.0 | 1,248.8 | Internal Affairs | 1,177.5 | 0.6% |
| 878.9 | 968.1 | 1,079.4 | 1,105.7 | 1,164.5 | Courts | 1,221.3 | 0.7% |
| 889.2 | 1,113.5 | 1,078.9 | 1,056.6 | 1,418.6 | Agriculture, Biosecurity, Fisheries, Food Safety | 1,342.5 | 0.7% |
| 1,430.3 | 1,475.5 | 1,597.0 | 1,463.3 | 1,622.9 | Oranga Tamariki | 1,702.2 | 0.9% |
| 1,501.8 | 1,680.1 | 2,028.2 | 1,689.5 | 1,824.1 | Foreign Affairs | 1,968.8 | 1.1% |
| 1,895.4 | 1,655.3 | 1,414.0 | 1,639.4 | 1,505.1 | Environment | 2,171.3 | 1.2% |
| 0.0 | 0.0 | 0.0 | 11.2 | 2,595.0 | Disabled People | 2,963.9 | 1.6% |
| 2,386.4 | 2,708.9 | 2,807.0 | 2,977.7 | 3,160.2 | Police | 3,023.5 | 1.6% |
| 2,180.8 | 2,259.9 | 2,513.6 | 2,768.3 | 3,044.7 | Corrections | 3,173.8 | 1.7% |
| 2,651.8 | 2,865.5 | 3,088.8 | 3,222.3 | 3,521.4 | Labour Market | 3,690.9 | 2.0% |
| 3,392.4 | 3,351.6 | 3,454.8 | 3,362.7 | 3,459.6 | Business, Science and Innovation | 3,835.4 | 2.1% |
| 5,168.3 | 5,622.9 | 5,992.0 | 6,972.8 | 5,296.4 | Defence | 5,800.2 | 3.1% |
| 2,417.2 | 5,507.8 | 7,785.8 | 6,898.1 | 5,506.0 | Housing and Urban Development | 10,426.2 | 5.7% |
| 7,053.7 | 8,561.6 | 9,456.1 | 9,058.7 | 12,990.9 | Transport | 11,021.0 | 6.0% |
| 19,681.9 | 20,424.4 | 22,757.1 | 23,068.8 | 23,843.8 | Education | 20,518.2 | 11.1% |
| 29,542.9 | 23,331.2 | 22,504.2 | 19,393.0 | 20,144.0 | Treasury & Finance | 21,734.0 | 11.8% |
| 26,440.0 | 26,627.9 | 27,134.9 | 28,369.1 | 31,510.9 | Health | 33,031.4 | 17.9% |
| 39,501.8 | 39,223.5 | 42,467.1 | 45,376.6 | 45,789.1 | Social Development | 48,375.2 | 26.3% |
| 154,111 | 154,562 | 165,256 | 165,893 | 176,303 | Total Expenditure | 184,179 | 100% |
| 365.3 | 401.8 | 420.9 | 435.0 | 454.2 | GDP (nominal, per RBNZ) | 485.6 | |
| 42.2% | 38.5% | 39.3% | 38.1% | 38.8% | Govt spending as % of GDP | 37.9% | |
| and this compares with taxes collected as follows: | |||||||
| 124,684 | 131,818 | 141,760 | 143,294 | 145,195 | Total Revenue | 153,119 | |
The data in this table is net spending, after fee and charges revenues have been deducted from the gross expenditure planned.
Sources: You can download the data behind these tables from the NZ Government website here.
9 Comments
Can you post a simple table of the %s behind the pie graph? E.g. what % is NZ super v education etc. thanks
See table above for Education. It is 11.1% of all spending. NZ Super will be revealed when we publish the 'Social Development' drill-down. It will likely be $26.5 bln in this budget, 14.3% of all spending.
Australia means-tests its government Age Pension by calculating both an income test
and an assets test
. Services Australia
runs both calculations and applies the test that yields the lower pension amount. [1]
1. The Income Test
This test assesses money you earn from all sources, including employment, account-based pensions
, and "deemed" interest on financial investments. [1, 2, 3]
- Income-free Area: Single retirees can earn up to \(\$218\) per fortnight, and couples (combined) up to \(\$380\) per fortnight, without affecting their pension.
- Reduction Rate:
For every dollar you earn over these thresholds, your Age Pension reduces by \(\$0.50\).
2. The Assets Test
This test evaluates the net market value of all your physical and financial assets. Your primary family home is strictly exempt
from this test, but any other property is included. [1, 2, 3]
- Full Pension Thresholds:
To get the maximum Age Pension, assessable assets cannot exceed \(\$321,500\) for single homeowners and \(\$481,500\) for homeowner couples.
[1]
- Reduction Rate:
If your assets exceed these base thresholds, your pension reduces by \(\$3\) per fortnight for every \(\$1,000\) over the limit.[1]
- Cut-off Limits:
You stop receiving any Age Pension (you hit the "cut-off") if your assessable assets exceed \(\$722,000\) for single homeowners or \(\$1,085,000\) for homeowner couples.[1]
3. The "Deeming" Rule
For financial assets (like bank accounts, shares, and superannuation balances), Services Australia
does not look at the actual interest you are earning. Instead, they apply government "deeming" rates, assuming your money is earning a fixed rate of return, and add this assumed return directly to your assessable income. [1, 2, 3]
Use the official Services Australia Payment and Service Finder
to calculate your eligibility based on your exact situation.
I Guess Australia can be pretty tough on pension as they have enforced 8-12% saving rates on company contributions for a long time.
NZ is going to have to life the 4+4% to 6+6% asap for younger NZers to start to build savings.
IIRC less than half Australian pensioners (>67) receive the pension.
Thanks. We really have our settings wrong.
More on super than education and growing.
It's a gerontocracy
Its an entitlement. We paid our parents pension as they paid our grandparents (the social contract). And its paid for the majority of pensioners by the reducing number of net taxpayers who are the people also saving & building assets.
Further:
"Wrightson added that NZ has the eighth lowest pension cost in the OECD (which has 38 countries as members) and NZ was in the lowest quartile for expenditure." (%of GDP)
https://www.interest.co.nz/personal-finance/129936/retirement-commissio…
Social contract isn't a real contract. It is a benefit officially, and never existed before 1898 for the history of NZ so it isn't in any way an entitlement. An expectation maybe.
Thanks great work but where does capital spending and depreciation fit into these figures ?
We welcome your comments below. If you are not already registered, please register to comment
Remember we welcome robust, respectful and insightful debate. We don't welcome abusive or defamatory comments and will de-register those repeatedly making such comments. Our current comment policy is here.