
By Bernard Hickey
A fall in house prices nationwide and continued record low interest rates helped improve home loan affordability in May to its best levels since April 2004, the Roost Home Loan Affordability report shows.
Affordability improved in most cities and provincial areas, including Auckland Central, Wellington, Hamilton and New Plymouth because of a drop in median house prices. Affordability worsened around Christchurch and Timaru as median prices rose amid demand for houses not damaged by the earthquake.
House prices and activity remain more buoyant in Auckland where a shortage of supply because of leaky buildings and little new building is adding to firm demand from migrants from the rest of New Zealand and offshore. Prices are broadly flat to weaker for most of provincial New Zealand and Wellington.
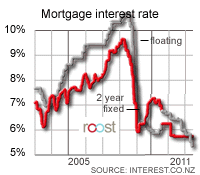
Interest rates remained flat at record lows in May, although the Reserve Bank commented early in June that the Official Cash Rate would have to rise gradually over the next two years. Wages rose slightly in May, helping to boost disposable income for borrowing.
First home buyer affordability also improved slightly in May and is at its best levels since November 2004, just before house prices started accelerating.
Banks have eased their lending criteria in recent months in an effort to boost lending volume growth from its record lows of around 1.4% a year. Lending was growing at 17% per annum in 2004.
“We are finding banks are increasingly keen to compete hard to win new business and keep existing customers,” said Rhonda Maxwell, spokeswoman for mortgage broking group Roost Home Loans.
Banks are offering loan to value ratios of up to 90 and 95% and are discounting establishment and legal fees in competitive situations, Maxwell said.
“First home buyers now see the best loan affordability ratios since 2004, particularly in smaller cities where house prices are lower and have fallen,” Maxwell said.
A young couple earning the median wage could afford to buy a first quartile priced house in May, with 21.1% of their disposable income required to service an 80% mortgage. This is down from 21.6% in April and down from a June 2007 high of 35.1%.
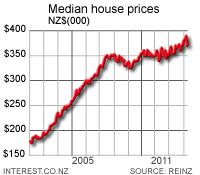 The national median house price fell to NZ$350,000 from NZ$360,000 in April and a record high of NZ$365,000 in March. The first quartile house price fell to NZ$248,750 from NZ$252,332 in April.
The Roost Home Loan Affordability report measures affordability nationally and regionally for individual income earners and households, taking into account median house prices, interest rates and incomes.
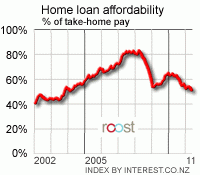
The Roost Home Loan Affordability measure for all of New Zealand showed the proportion of a single median after tax income needed to service an 80% mortgage on a median was 51.3% in May from 53.0% in April. The worst level of affordability was 83.4% seen at the peak of the house price boom in March 2008 when 2 year mortgage rates were close to 10%.
Affordability has been improving since December 2009 as house prices have flattened out and interest rates have fallen, the monthly measure calculated by interest.co.nz in association with Roost found.
More than 50% of home owners are now on floating mortgages and most new borrowers are choosing to float, given floating rates at around 5.75% are cheaper than average longer term fixed rates at around 6.2%. The Home Loan Affordability reports are now using the floating rate.
Affordability is difficult in Auckland, Wellington, Christchurch, Hamilton and Tauranga for those on a single median income, but homebuyers in smaller provincial cities will find home ownership much more affordable. Households with two incomes are also in a stronger position, particularly those bidding for homes priced in the lower quartile.
 Affordability for households with more than one income improved slightly because of the fall in interest rates. This measure of a ‘standard typical household' found the proportion of after tax income needed to service the mortgage on a median house was 33.8% at the end of May from 34.9% in April and a record high of 54% in November 2007.
This measure assumes one median male income, half a median female income aged 30-35 and a 5 year old child that receives Working-for-Families benefits. Any level over 40% is considered unaffordable for a household, whereas any level closer to 30% has coincided with increased buyer demand in the past.
The survey’s measure of a ‘standard first-home-buyer household' found the proportion of after tax income needed to service the mortgage on a first quartile home fell to 21.1% in May from 21.6% in April and a record high of 34.9% in November 2007.
This measure assumes a first home buyer household includes a median male income and a median female income aged 25-29 with no children. Any level over 30% is considered unaffordable in the longer term for such a household, while any level closer to 20% is seen as attractive and coinciding with strong demand.
Question and Answers about the report
How does interest.co.nz work out these numbers?
Interest.co.nz gathers data from Statistics New Zealand and IRD on wages in each region, data from the Real Estate Institute from each region each month, and data from banks and non-banks on interest rates. It has calculated home loan affordability going back to the beginning of 2002.
How is this survey different from the Massey University survey of affordability?
The Massey study is only done quarterly rather than monthly and uses an index of Home affordability rather than actually measuring home loan affordability. It uses an index rather than the actual measure of the proportion of after tax pay needed to service an 80% mortgage on a median home. The exact composition and meaning of the index is not detailed.
Why use a single median income rather than household income?
It’s true that most homebuyers are using a combination of one or more full or part time incomes to service their mortgage. Each household is different and may be using incomes from different sources. The best measure of average national household income is calculated officially once in every three years by Statistics New Zealand. Interest.co.nz chose to use the median income data series from IRD and Statistics NZ because it can be measured monthly and can be drilled down by region and by age. We do include a chart showing how many median incomes are required to keep mortgage payments at 40% of take home pay. It is currently around 2 median incomes.
Why is home loan affordability important?
It is a useful way to work out if a housing market is overvalued. It’s clear house prices stopped rising when the national affordability ratio rose above 80% or 2 median incomes to service the average home loan. It’s a way of comparing affordability of housing markets with a national average and comparing housing values from one year to the next. For example, the affordability ratio in 2002 before the housing boom really took off was around 41%.
About Roost
Roost is the sponsor of this Report, and the Reports must be referred to as the Roost home loan affordability reports. Roost, owned by AMP, is one of New Zealand’s largest independent home loan and investment property mortgage brokers with 16 franchisees nationwide. Roost offers to source the perfect loan for its customers from a panel of lenders and insurance advice from Roost insurance specialists. Roost was established in 1996. For more information please visit www.roost.co.nz
No chart with that title exists.
We welcome your comments below. If you are not already registered, please register to comment
Remember we welcome robust, respectful and insightful debate. We don't welcome abusive or defamatory comments and will de-register those repeatedly making such comments. Our current comment policy is here.