
Almost everyone in New Zealand knows that per capita incomes have been drifting backwards for at least two years. Looking back further, Dean Brunskill here at interest.co.nz has authored a graph showing that per capita GDP in September 2024, which is the latest available data, was essentially the same as five years previously in pre-COVID September 2019.
Although the presence of tough times has been and is obvious, the fundamental reasons why this has been happening are a subject of debate.
Separating fundamental long-term trends from short-term economic cycles is easy with hindsight but can be complex in real time. Similarly, separating fundamental causes from symptoms and noise can get very muddled. There is also a subjective overlay of politics in terms of who should bear the blame.
The key take-home proposition in this article, which I will now develop, is that New Zealand has a fundamental problem in that the value of exports from goods and services is too low relative to the total cost of the goods and services coming into the country.
This trade deficit combines with a very big outflow of interest payments to foreign investors, plus foreign-investor profits. Accordingly, my proposition is that New Zealand will not see sustained economic growth without a major lift in exports.
This problem of inadequate exports at the heart of poor economic performance has been an issue for a long time, but it has got a lot worse since 2021. This is in part because the interest on debt owned by overseas investors has increased greatly. These interest payments, plus profit on an increasing level of overseas-owned equity investments, have been soaking up increasingly large quantities of foreign exchange.
To place the exports issue in context, it is necessary to understand the basics of current-account economics for an open economy such as New Zealand. This current account measures the net effect of all income and expenditure cash flows between New Zealand as a nation and the rest of the world.
If there is a deficit in the current account, then there has to be a corresponding balancing inflow of new capital via the capital account, with that capital inflow subsequently generating its own outflow of earnings via interest and profit.
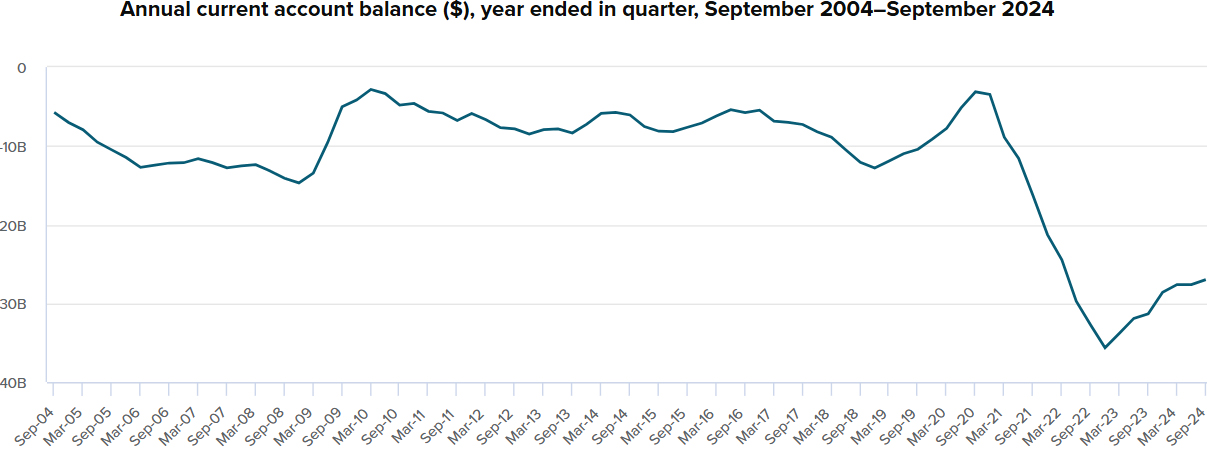
The graph that follows, sourced from StatsNZ, demonstrates what has been happening to New Zealand’s current account. Yes, it is a dismal story but it needs to be told.
Source: StatsNZ
This graph demonstrates how for much of the last 20 years we bobbled along with current account deficits in New Zealand dollars of between $4 billion and $12 billion per annum. These deficits were financed by corresponding inward flows of overseas capital.
This meant our national debt was increasing, but these were generally good times for export prices. Accordingly, and in broad terms, servicing the debt seemed manageable without any ballooning of the overall current-account deficit.
Then things went crazy in late 2021. By March 2023 the annual deficit had ballooned to $33 billion, 8.5 percent of GDP. Thereafter, the annual deficit bounced back somewhat by September 2024 to $27 billion, comprising 6.4 percent of GDP. There is general agreement among economists that this level is still unsustainable.
Remember, the only way to balance these deficits is by foreign investors continuing to further invest in New Zealand. As we should all know, this investment by foreigners in New Zealand does not provide free lunches.
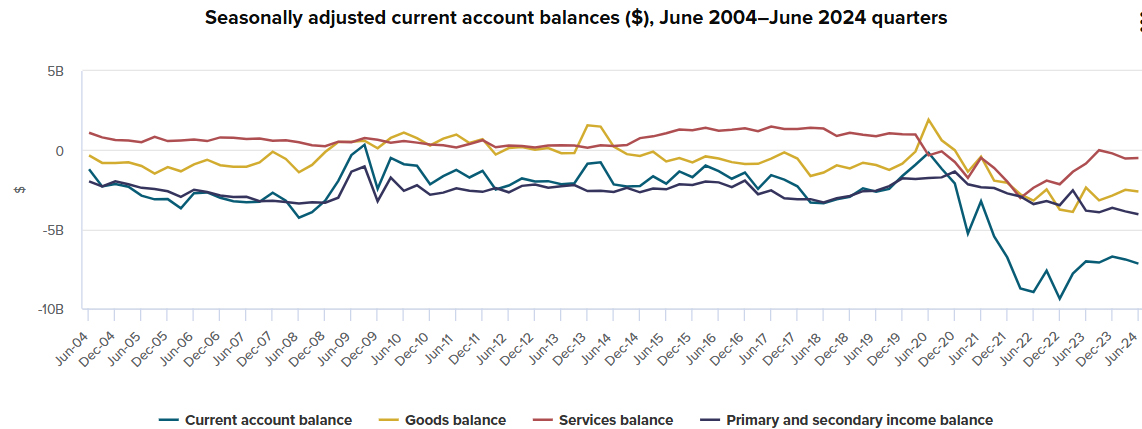
The next graph illustrates something of the ‘how and why’ relating to the ballooning of current account deficits that started in 2021. Note that these data, which are also from the Stats Department, are quarterly data, not annual data. What we can see is that all three components of the current account got on a slippery slide, which helps to understand why the overall current-account deficit (the blue line) fell off a cliff.
Source : StatsNZ
Looking first at the ‘goods balance’, i.e. physical exports minus physical imports, this is represented by the yellow line. We can see that 2020 was an outstanding year with exports getting out to market but imports being low. There is no big mystery there, with COVID providing the answer. Thereafter, we have had three years on the slippery slide with imports greatly exceeding exports in each quarter in a way that never happened in the preceding 20 years.
Turning to the services balance (the red line), we can see that for many years we were almost always in surplus through to the start of COVID. This was largely driven by the tourist industry and overseas students, with both of these taps being shut off by COVID. It was only because New Zealanders were also prevented from international travel that the services balance did not crash totally. Clearly, there has been somewhat of a recovery in the last 18 months but New Zealand is still running overall deficits on services.
Then comes the primary and secondary income balance, depicted by the dark grey line. Some explanation of the terminology will be necessary for most readers.
Quite simply, the primary income is the net foreign exchange flow from interest and profits. Think of it as being the ongoing cost of past current-account deficits which were funded by an inward flow of capital. It can be thought of as being today’s ongoing cost of yesterday’s lunch that was funded with borrowed money, together with interest on more than one hundred years of historical lunches that were also purchased with borrowed money.
As of September 2024, the net overseas debt plus foreign-owned equity which we had to service via interest and profit repatriations was $209 billion. That is a lot of lunches, requiring a lot of exports to provide the funds.
The secondary income is the funds flow arising from overseas aid and remittances sent back home by migrants to their families. In New Zealand’s case, this secondary outflow is much less than the primary outflow.
It is evident that New Zealand’s balance on primary and secondary income has been negative each year but that it has got a lot worse in the last three years. This reflects both the overall increase in New Zealand based assets that are owned by foreigners relative to overseas assets owned by New Zealanders, and the impact of higher interest rates that are received by foreigners on the funds they lend.
The outward flows of primary and secondary income would be less of a problem if the incoming capital had been used for productive purposes. But alas, most of it was used to support consumption.
The economic bottom-line is that if we are to ever pay our own way, then we will either need to earn a lot more from overseas trade in goods and services or spend a lot less on imports. Most likely we will need to do both.
Alternatively, we can continue to borrow more money from overseas and also sell more assets, as long as foreigners still think these assets are a good buy. That is where the exchange rate comes into play.
The foreign exchange rate is the price mechanism that ensures foreign exchange inflows balance outflows in an open economy. The rate goes up and down according to overall supply and demand for foreign exchange.
If we are consistently living beyond our means, then eventually the New Zealand dollar declines in value relative to international currencies and vice versa.
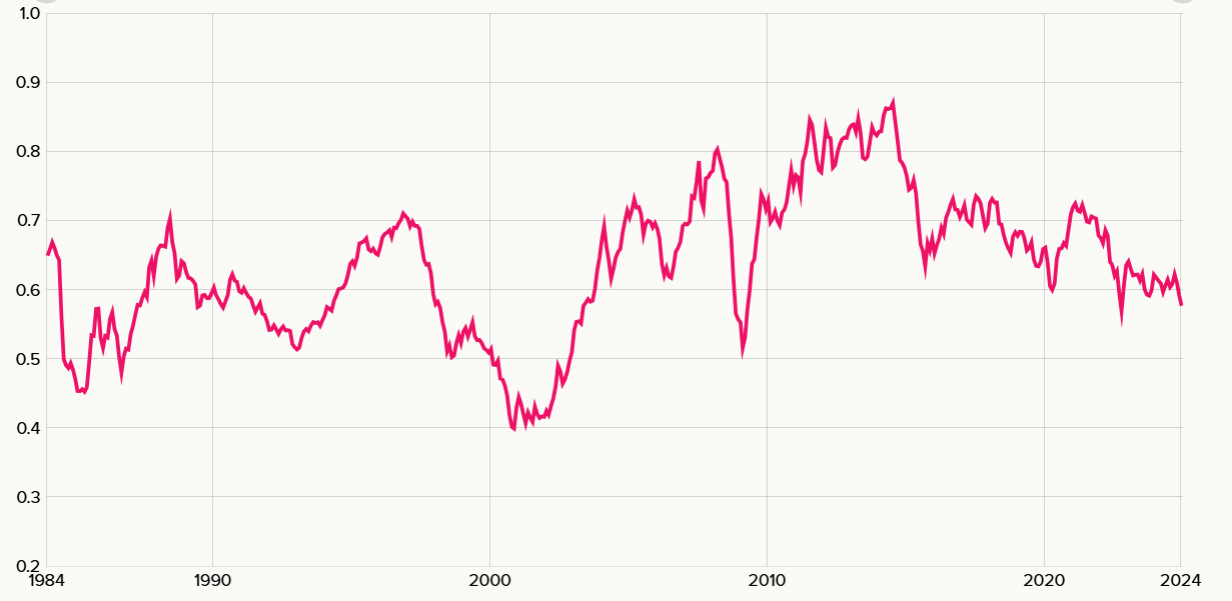
The next graph sourced from the RBNZ shows the relationship between the New Zealand dollar and the American dollar over the last forty years, with the New Zealand dollar varying between 40 and 87 American cents.
Source: RBNZ
Looking back to the mid-1980s, when New Zealand opened up its economy to the rest of the World, this graph shows that there was lots of volatility for close on 20 years through until around 2004. Those were challenging years when New Zealand was battling through tough times. Then came the good times for New Zealand consumers through to 2015 when the New Zealand dollar was strong, with a brief exception caused by the 2008/9 GFC.
Those good times for consumers were largely a consequence of export volumes increasing, plus export prices rising faster than import prices. Primary industries, and dairy in particular, were the right place to be, but the benefits flowed through to everyone.
Then came the last ten years with the New Zealand dollar weakening relative to the American dollar. This correlates with increasing import levels, plus the compounding effects of increasing national debt, plus a lack of growth in export volumes.
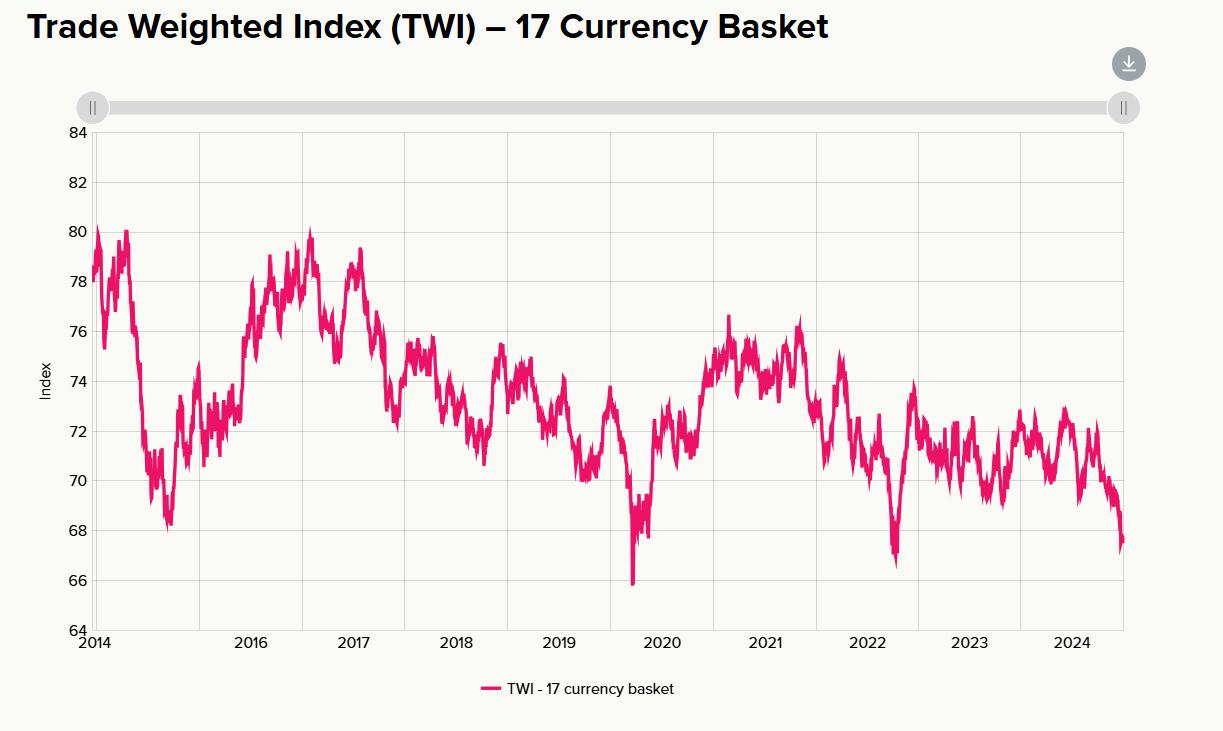
This decline in the last ten years has not only been in relation to the American dollar. The next graph from the RBNZ shows how our dollar has also been declining against a trade-weighted basket of 17 currencies. The index value has dropped from 80 to 67 in that time, which is a decline of 16 percent.
Source: RBNZ
Accordingly, it does not matter how the story is told, there is a hard reality that the New Zealand economy has been on a slippery slope for the best part of ten years. The years ahead will now be challenging, as we have to pay for the lunches we have consumed historically and which we continue to consume.
One important point to emphasise is that all of the above numbers relate to New Zealand as a nation and not just to the Government’s debt.
The Government debt has also been growing, with $99 billion of Government debt as of November 2024 now being held by foreigners in the form of Government bonds (calculated from RBNZ data), and so this is part of the international liabilities of New Zealand as a nation.
However, what I have been talking about here is not just the Government, but the international debts of the overall nation. The two issues are linked, and Government deficits funded by foreigners are one part of the problem, but they are not the same.
Much of what I have written above comes across as a dismal story. I would therefore like to have finished on an optimistic note about the opportunities that lie ahead with our export industries. However, it is not that simple. Very few of our export industries are currently growing in volume.
The Government has a target of doubling export income in the next ten years with much of this coming from increased export prices. How this will happen is not obvious.
So, this article ends with three questions. How can New Zealand get out of the economic mire? Where will export-focused economic growth come from? What are the specific policies to make that happen? These are matters that we all need to be thinking about.
I have some ideas on what the answers could be but implementation won’t be easy. Those ideas are for some future articles.
*Keith Woodford was Professor of Farm Management and Agribusiness at Lincoln University for 15 years through to 2015. He is now Principal Consultant at AgriFood Systems Ltd. You can contact him directly here.

We welcome your comments below. If you are not already registered, please register to comment
Remember we welcome robust, respectful and insightful debate. We don't welcome abusive or defamatory comments and will de-register those repeatedly making such comments. Our current comment policy is here.