
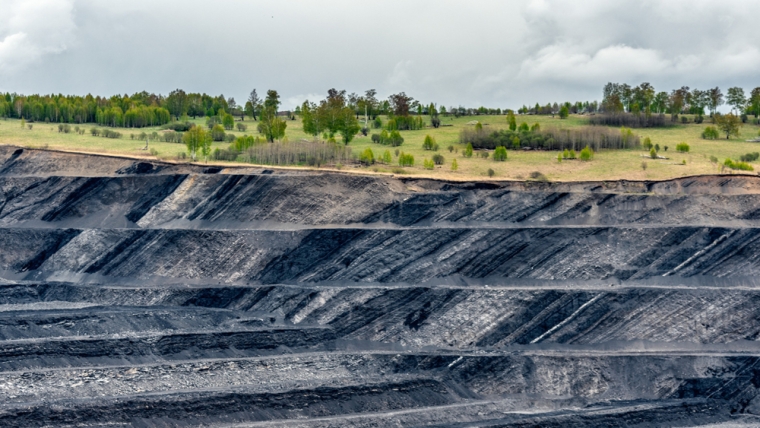
Australia’s economy is sometimes referred to as a quarry with a farm on the side. That’s a description that’s been around for decades but it remains surprisingly true today.
Take the latest figures from the Australian Bureau of Statistics (ABS) for international trade in goods for September 2023.
| Exports A$ bln |
|
| Ores and minerals | 16.0 |
| Coal and other fuels | 14.5 |
| Metals | 1.2 |
| Agriculture | 6.2 |
| Machinery & other mfg | 3.8 |
Mining and agricultural exports were ten times greater than manufacturing exports. Australia is an advanced, wealthy economy but it’s still heavily reliant on what it digs out of, or grows on, the ground.
Services are also an important part of any modern economy. In Australia’s case export services are dominated by tourism and education.
The country’s heavy reliance on the mining sector exposes the country to the ups and downs of the world economy and of China in particular.
The most recent GDP figures from the ABS indicate that the Australian economy grew by just 0.2% in the September quarter. What growth there was, was driven by immigration and government expenditure. On a per capita basis, GDP declined by 0.5%, the second quarterly decline in a row.
Australia’s terms of trade fell 2.6% through a combination of falling export prices (-1.4%) and rising import prices (+1.2%). Coal and gas prices were down.
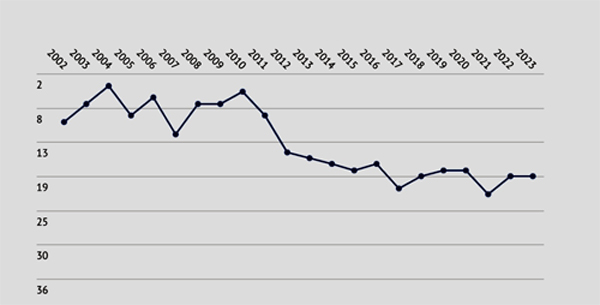
The economic challenge of Australia’s dependence on mining was evident in this year’s IMD World Competitiveness Rankings. Out of the 64 countries surveyed, Australia placed first in ‘terms of trade’ (and second in ‘student inbound mobility’). However, it came a poor 58th in ‘economic complexity’ and a remarkably disappointing 62nd in ‘entrepreneurship’.
Australia remained in 19th place for overall competitiveness but from the perspective of the last two decades, the picture is more concerning. (New Zealand was 31st).
Australia’s IMD World Competitiveness ranking
Source: Committee for Economic Development
In its analysis of the results, the Committee for Economic Development of Australia (CEDA) stressed Australia‘s need to diversify its economy. CEDA Chief Economist Cassandra Winzar said that ‘strong commodity prices and a healthy jobs market continue to drive Australia’s competitiveness, but we cannot keep relying on our traditional strengths’.
The danger is that the lucky country’s luck will run out.
Another notable feature in the IMD rankings was the unfavourable results for taxation. Australia was ranked 57th on ‘personal income tax’ and 56th on ‘company tax’.
An Executive Opinion Survey was carried out as part of the competitiveness ranking. Respondents had to select from 15 indicators what they viewed as ‘key attractiveness factors’. For Australia, far and away the lowest ranked indicator was ‘competitive tax regime’.
Fortunately for Australia, its natural resources are so abundant that the mining sector flourishes despite the relatively unattractive tax regime. Just how fortunate is evident from the latest Corporate Tax Transparency Report released by the Australian Taxation Office (ATO) last month.
That report shows the amount of income tax paid in 2021-2022 by large companies. There were 2,713 companies that met the qualifying income threshold of $100 million and in total they paid $83.8 billion in income tax.
Incredibly, according to ATO Deputy Commissioner Rebecca Saint, ‘the mining sector paid more tax than all other sectors combined’. In other words, more than half of the income tax from the large corporate sector in Australia was paid by mining companies.
Thirteen companies paid $1 billion or more in tax. The list is revealing.
| Tax paid (A$ bln) |
Sector | |
| BHP Group | 9.5 | Mining |
| Rio Tinto | 9.1 | Mining |
| Fortescue Metals | 3.5 | Mining |
| CBA | 3.0 | Banking |
| Westpac | 2.2 | Banking |
| BHP Iron Ore | 1.9 | Mining |
| NAB | 1.6 | Banking |
| ANZ | 1.6 | Banking |
| Mitsubishi Development | 1.4 | Predominantly mining |
| Roy Hill | 1.4 | Mining |
| Glencore Investment | 1.3 | Mining |
| Mitsui | 1.1 | Predominantly mining |
| Hancock Prospecting | 1.1 | Mining |
Without the miners and the banks, the company tax revenues derived by the federal government would look very different.
Significantly, income tax is not the only ‘tax’ paid by the mining sector in Australia. Royalties are paid to state and territory governments on a range of mineral extractions. According to figures prepared by Ernst Young for the Minerals Council of Australia, mining royalties of $23.8 billion were paid in 2021-2022.
The vast majority of these royalties went to three states – West Australia ($11.5 billion), Queensland ($7.8 billion), and New South Wales ($3.6 billion).
All up, in 2021-2022 the mining sector paid around $64 billion in company tax and royalties to governments in Australia. That’s a lot of new schools and hospitals, a lot of infrastructure and social welfare.
The abundance flowing from the mining sector goes a long away to explaining the strength of the Australian economy relative to that of New Zealand.
Of course, that abundance is dependent on the world continuing to want what Australia mines. The transition away from fossil fuels like coal and gas is clearly a threat. However, that transition is driving the demand for batteries which require lithium. Australia’s lithium exports went from nothing just a couple of years ago to $4.9 billion in 2021-2022. They are expected to leap again to a staggering $18.6 billion in the current financial year.
There’s no sign of the lucky country’s luck running out just yet.
*Ross Stitt is a freelance writer with a PhD in political science. He is a New Zealander based in Sydney. His articles are part of our 'Understanding Australia' series.
We welcome your comments below. If you are not already registered, please register to comment
Remember we welcome robust, respectful and insightful debate. We don't welcome abusive or defamatory comments and will de-register those repeatedly making such comments. Our current comment policy is here.