
The sharp rise in unemployment reported recently for the September quarter caught many economists and other observers by surprise.
Some even noted that the Household Labour Force Survey on which these numbers are based is known to occasionally throw up 'rogue' results.
One aspect that puzzled the experts was the weakness in the construction sector in the HLFS data. That seemed to be unusual given the obviously growing Christchurch reconstruction.
However, new data released late yesterday by Statistics NZ tends to confirm the earlier employment stats.
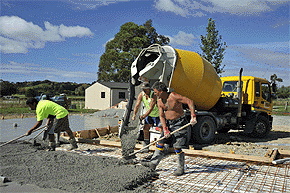
This new data records Q3 readymix concrete production and shows that apart from Christchurch, output has been weak.
It was startlingly weak in the Wellington region, falling to a 20 year low.
| Q3, 2011 | Q3, 2012 | change | |
| m3 | m3 | % | |
| Auckland metro | 169,154 | 157,385 | -7.0 |
| Waikato, BOP | 108,972 | 119,262 | +8.4 |
| Taranaki. Manawatu, etc | 95,374 | 79,727 | -16.4 |
| Hawkes Bay, Gisborne | 27,562 | 23,101 | -16.2 |
| Wellington metro | 31,565 | 25,540 | -19.1 |
| Christchurch metro | 81,064 | 130,260 | +60.7 |
| New Zealand | 676,512 | 717,286 | +6.0 |
We welcome your comments below. If you are not already registered, please register to comment
Remember we welcome robust, respectful and insightful debate. We don't welcome abusive or defamatory comments and will de-register those repeatedly making such comments. Our current comment policy is here.