

Conversations about migration often just assume that wages are being depressed because the arrival of new people is at record levels.
The basis is the data in the Quarterly Employment Survey (QES) which showed that average wages rose only +0.4% in the June quarter, or +2.25% in the full year.
It is easy to pick data that supports a political stance, but what I want to fact-check here is that pay rates are lower than they have been because of the population increase due to fast-rising immigration.
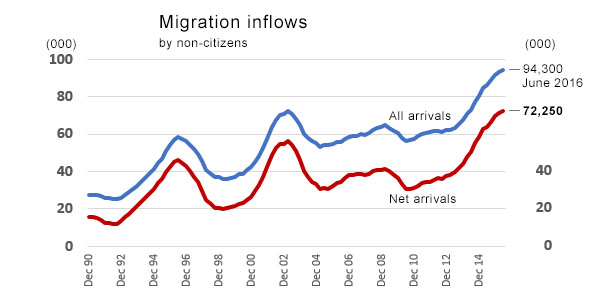
Here is the migration change in its full historical perspective for all non-citizen arrivals:
And here is the change in wages over a 25 year time span:
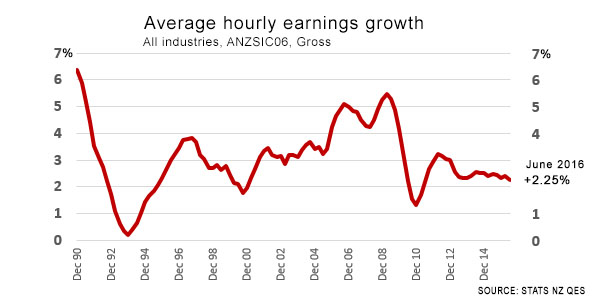
It seems clear from this data that pay rises have been at the lower end of the range recently.
But this ignores two pertinent facts.
One is that there have been three income tax rate reductions. One was offset by a GST rate rise. None of these changes show up in this chart, but they do have the net effect of making net pay higher.
The other is that inflation (price increases for living expenses) has been much lower recently. That also improves spending power, making any pay increase go further.
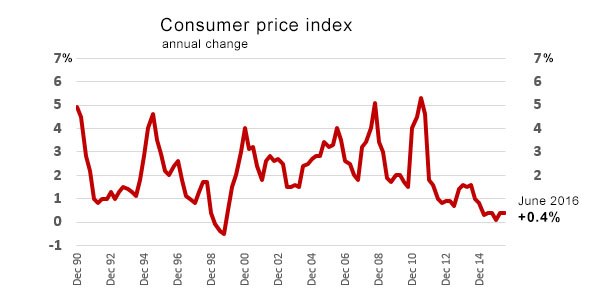
This we can measure, deriving a 'real' rate of wage change. This chart deducts the CPI from the first chart:
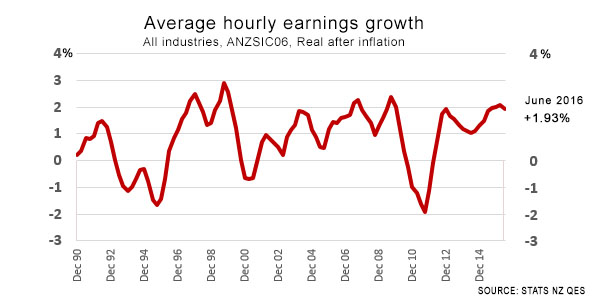
On an inflation-adjusted basis, current pay increases actually benchmark well over the past 25 years.
It is not possible to see a drop in 'real' earnings growth in the period of rising migration.
What you can see is the impact of inflation. But not migration.
Those who say more arrivals are causing pay rates to stagnate or even go backwards can't support that argument with the data.
What they seem to be confusing is the fact that lower wage increases are here because lower inflation is here, but as the inflation rate is much lower, real wages are actually rising at the upper end of the range they always have over the past 25 years.
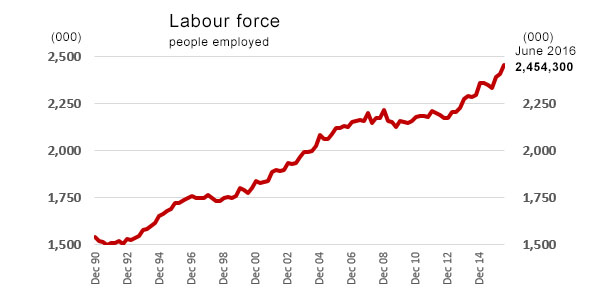
At the same time, the number of people employed is rising quickly, now growing at a rate as fast as in other strong expansion periods and faster than the growth in migration.
For the record, here is the CPI series on the same basis as the charts above:
We welcome your comments below. If you are not already registered, please register to comment
Remember we welcome robust, respectful and insightful debate. We don't welcome abusive or defamatory comments and will de-register those repeatedly making such comments. Our current comment policy is here.