

It is time to bust some myths about bank funding. Some of them come out of our comment stream, one from the banks themselves.
The data is openly available for all registered banks from the RBNZ website on series S6. All the detail here is for the banking industry as a whole, not necessarily for any one bank.
Myth 1. "Banks get minuscule funding from households"
This is a common myth. If is far from true. Banks get about half their NZ dollar funding from bank accounts/deposits from households.
Further, this source of funding is growing, not declining.
Ten years ago, (January 2007 and pre GFC) banks got 35.2% of their NZ dollar funding from households. In January 2017 that had risen to 46.8%, touching the record high of 46.9% in September 2016.
Of course, NZ dollar funding is only a part of banks' total funding. But it is a growing part.
Ten years ago 62% of bank funding was sourced domestically. But by January 2017 that had grown to 72%.
So that busts another myth.
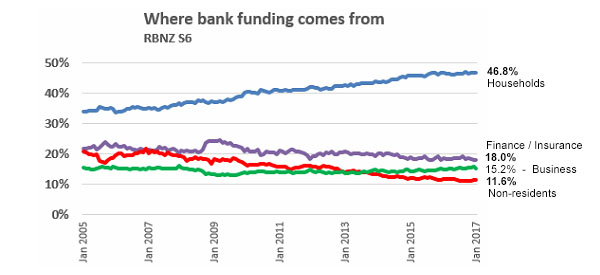
This chart shows proprtions of NZD funding, line A1 in RBNZ S1
There are four other minor categories not shown in this chart.
Myth 2. "NZ banks are mainly reliant on offshore funding"
They are not.
Here is the detail:
| Source: RBNZ S1 | NZ residents | Non-residents | Total funding |
| NZ$ bln | $ | $ | $ |
| January 2017 | |||
| NZ dollar funding - (the chart above) | 300.7 | 39.5 | 340.2 |
| Funding from central govt. accounts | 2.2 | 0.0 | 2.2 |
| Foreign currency funding (in NZ$) | 9.5 | 84.5 | 94.0 |
| -------------------------------------------- | --------- | --------- | ------- |
| Total funding in NZ$ Jan-2017 | 312.3 | 124.1 | 436.4 |
| 72% | 28% | 100% | |
| January 2007 | |||
| NZ dollar funding | 152.2 | 38.8 | 191.0 |
| Funding from central govt. accounts | 0.6 | 0.0 | 0.6 |
| Foreign currency funding (in NZ$) | 8.5 | 60.4 | 68.9 |
| -------------------------------------------- | --------- | --------- | ------- |
| Total funding in NZ$ Jan-2007 | 161.3 | 99.3 | 260.5 |
| 62% | 38% | 100% |
Sure, in 10 years, our banks have borrowed $25 bln more overseas. But they have also sourced a massive $151 bln more locally. That shift has allowed our banking system's exposure to foreign creditors to fall significantly. More to do? yes. But it is going in the right direction. If you are still critical of how much we rely on offshore debt for our banking system to function, you need to suggest a 'safe' level.
Myth #3. "Banks are taking advantage of us"
Actually, the evidence is that it is an own goal. We as customers don't manage our deposits well. We leave far, far to much in accounts not accruing interest, or in too-short term accounts bearing very low interest.
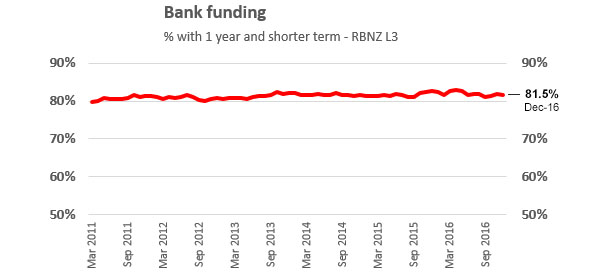
It is hard to believe perhaps, but more than 80% of bank funding is in accounts that mature in less than 12 months.
A closer look at the detail shows that 37% is held at call, and another 21% is due in 90 days or less, and another 13% is due 3-6 months.
New Zealanders think very short term when it comes to their own finances.
And we have done so for a very long time. It was over 80% ten years ago too.
You can hardly blame banks if they take advantage of customers who just won't commit for a medium term
They know what their 'replicating portfolio' of lazy money is, and are taking advantage of it. Change will only come if customers change their money-management habits.
Myth #4. "Bank margins are under pressure because interest rates are rising"
To be fair to banks, they don't say it exactly like this. They talk more generally about "margins under pressure", and they are*.
But it is not because of rising interest rates, nor because credit spreads are rising.
In the US wholesale markets, there were some changes in 2016 that affected the availability of offshore funding and the rate. But that hasn't affected bank fund raising much at all.
And as we saw above, most of their funding is domestic.
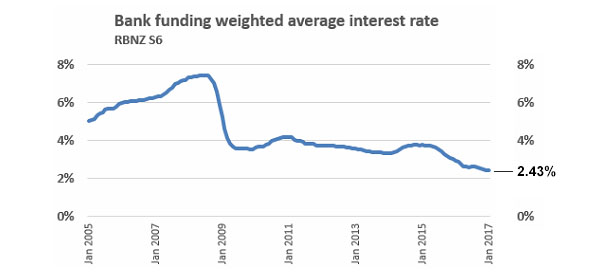
The same RBNZ series that reveals the funding maturity also reveals the "weight average interest rate" on this funding.
The bald fact is, the January 2017 average rate of 2.43% is a record low since when this series started twelve years ago. The record is likely to be much longer than that, as this graph suggests.
* = Margins are under pressure because the volume of transactions is no longer growing. It is a dollar shrinkage of margin, not a rate shrinkage.
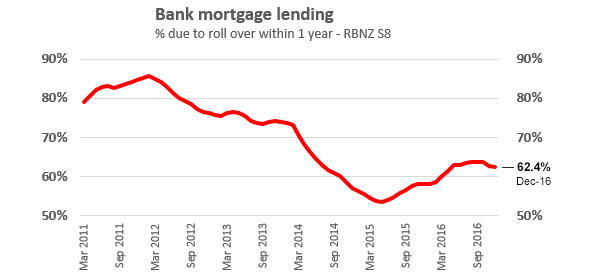
I made another chart when researching this story. It is interesting all the same even though not strictly relevant here.
We welcome your comments below. If you are not already registered, please register to comment
Remember we welcome robust, respectful and insightful debate. We don't welcome abusive or defamatory comments and will de-register those repeatedly making such comments. Our current comment policy is here.