

The usual focus from our migration statistics is the net level of new migrants we are attracting.
But that data is a mix of foreigners applying to come here, and New Zealand citizens returning.
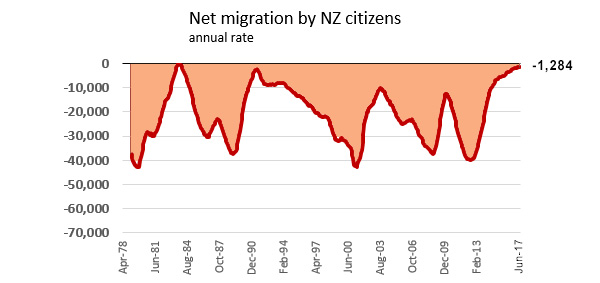
The net of these is now running at a fast pace of inbound migration, totalling 72,305 over the past year.
But included in this are permanent movements by New Zealanders; this analysis focuses on them (us).
Migration by Kiwis has always been a 'canary in the mine' for how we assess our forward economic prospects.
Leaving for an OE is a rite of passage for young Kiwis, but leaving to overcome economic stress is another powerful reason.
The country's risk is that not everyone returns; we lose some bright, go-getter people this way.
But in the year to June 2017, that net outflow has been reduced to a very small trickle. In fact it is now at its lowest flow in over 30 years. The last time it was this low was in February 1984. (And I was a part of the returning group, enthusiastic about New Zealand's prospects after the rapid reforms that flowed out of that era-changing 1984 election.)
But reform at that time was not painless, even if many accepted it was necessary and inevitable.
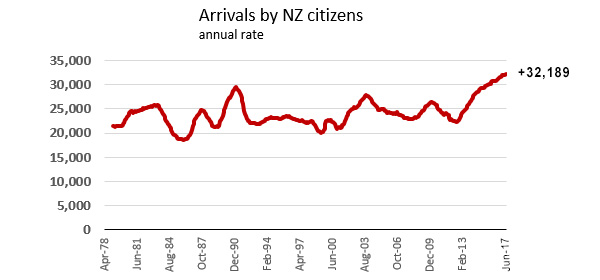
Fast forward to 2017, and we have a situation where we are seeing record numbers of our citizens returning.
This flow has never been as high.
The following chart tracks citizens who are returning permanenty (and excludes returning visitors). "Permanently' is as described on arrival cards, and is for those who say they are returning for 12 months or more.
All data in the following charts and table are from Statiscs New Zealand's Infoshare resource.
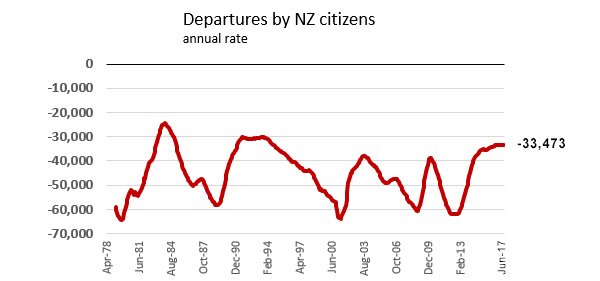
Going the other way are 'departures', defined the same way.
Citizens are not leaving in the numbers they used to. The number for the year to June 2017 is now the lowest since September 1994, the least in 23 years.
Here is the impact of net migration by New Zealand citizens on some key, large regions, colour-coded for the changing National / Labour / National governments:
| year to June | Auckland | Waikato | BofP | Wellington | Canterbury | New Zealand |
| 1992 | -3,662 | -629 | -245 | -1,671 | -564 | -8,375 |
| 1993 | -3,170 | -577 | -417 | -1,842 | -914 | -8,641 |
| 1994 | -2,662 | -823 | -603 | -1,912 | -843 | -9,113 |
| 1995 | -3,819 | -1,141 | -668 | -2,396 | -1,410 | -13,214 |
| 1996 | -5,072 | -1,507 | -660 | -2,845 | -1,826 | -16,498 |
| 1997 | -7,297 | -1,577 | -935 | -2,995 | -2,440 | -20,537 |
| 1998 | -7,375 | -1,766 | -1,246 | -3,161 | -2,652 | -22,052 |
| 1999 | -10,902 | -2.860 | -2,094 | -4,174 | -3,605 | -31,706 |
| 2000 | -11,045 | -2,797 | -2,057 | -4,895 | -4,121 | -32,935 |
| 2001 | -15,370 | -3,327 | -2,184 | -5,392 | -4,210 | -41,901 |
| 2002 | -6,395 | -1,479 | -1,221 | -2,320 | -2,018 | -19,908 |
| 2003 | -3,449 | -1,015 | -844 | -1.376 | -883 | -11,493 |
| 2004 | -4,909 | -1,171 | -1,123 | -1,520 | -864 | -15,039 |
| 2005 | -7,227 | -1,890 | -1,788 | -2,464 | -1,901 | -22,423 |
| 2006 | -7,434 | -2,152 | -1,852 | -2,565 | -2,348 | -23,734 |
| 2007 | -9,026 | -2,451 | -2,052 | -2,859 | -2,774 | -28,370 |
| 2008 | -11,420 | -3,021 | -2,651 | -3,682 | -3,517 | -35,291 |
| 2009 | -9,409 | -2,561 | -2,192 | -2,679 | -2,607 | -27,659 |
| 2010 | -5,603 | -1,367 | -1,078 | -1,323 | -1.174 | -14,236 |
| 2011 | -9,464 | -2,785 | -2,205 | -2,879 | -3,712 | -29,904 |
| 2012 | -12,456 | -3,579 | -2,990 | -3,708 | -4,447 | -39,507 |
| 2013 | -12,438 | -2,964 | -2,278 | -3,243 | -1,901 | -31,741 |
| 2014 | -5,634 | -886 | -780 | -1,746 | -299 | -12,058 |
| 2015 | -3,489 | -118 | -68 | -1,268 | -174 | -5,644 |
| 2016 | -3,414 | +87 | +327 | -785 | -67 | -3,139 |
| 2017 | -2,486 | +146 | +331 | -599 | +144 | -1,284 |
You can look at this data and see the effects on migration from some major changes to the economic landscape, like
- bringing in a new top rate of income tax at 39% in 1999, (which also arguably incentivised investor real estate decisions to chase tax-free capital gains),
- the 2008 global financial crisis,
- the 2011 Christchurch earthquakes,
- the housing affordability stresses, especially in Auckland, that started to become particularly acute in 2014.
There may be others.
But by any measure, New Zealanders are not voting with their feet to leave with anywhere near the same conviction in 2017 as they did in 2001, 2008 or 2012.
We welcome your comments below. If you are not already registered, please register to comment
Remember we welcome robust, respectful and insightful debate. We don't welcome abusive or defamatory comments and will de-register those repeatedly making such comments. Our current comment policy is here.