

The growth of household deposits in the banking system has taken a step-change lower. And it has stayed down.
The Reserve Bank has the data (S40). For all of 2024 and the first eight months of 2025, year-on-year growth in household deposits averaged more than $15 billion per month.
But that then transitions lower to an average of just over $10 billion per month.
Year-on-year growth of household bank deposits
| 2024 | 2025 | 2026 | |
| $ bln | $ bln | $ bln | |
| Jan | 14.437 | 16.791 | 9.829 |
| Feb | 13.676 | 17.130 | 9.585 |
| Mar | 14.383 | 15.940 | 10.719 |
| Apr | 14.173 | 17.456 | 10.659 |
| May | 14.794 | 16.158 | 10.710 |
| Jun | 13.530 | 16.819 | |
| Jul | 15.201 | 15.427 | |
| Aug | 13.433 | 15.256 | |
| Sept | 15.873 | 13.024 | |
| Oct | 16.011 | 11.928 | |
| Nov | 15.732 | 11.181 | |
| Dec | 17.451 | 10.582 |
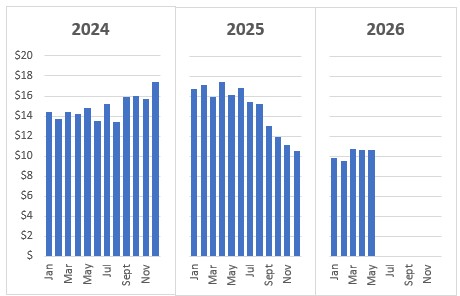
The latest data update, for June, is due this Friday and it will be a surprise if it doesn't extend the lower trend.
Households with term deposits are noticing this step down. And they seem to regards this in a risk-aversion sense.
Their reaction has been to hold more in transaction accounts. The liquidity impulse is stronger.
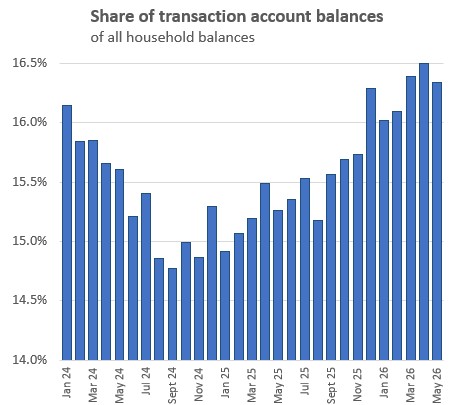
Although the chart shows this impulse is definitely there, it would be wrong to overstate it. Check the left-hand axis - the shift is only about 1½%. However that is 1½% of $142 billion, which means households are keeping an extra $3 billion every month in ready cash, rainy day cash reserves.
Retailers will notice that caution too.
It's a move that reprises the pandemic shift, one that was much more pronounced back then. For most of 2019 households had less than 15% of their bank account balances in transaction accounts. But as fear and uncertainty rose in the 2020 to 2022 period, that jumped to over 24%. The current worry levels are not back at those levels, but this analysis shows that they are rising and that households are shifting their ready cash allocations to a more risk-averse mode.
We welcome your comments below. If you are not already registered, please register to comment
Remember we welcome robust, respectful and insightful debate. We don't welcome abusive or defamatory comments and will de-register those repeatedly making such comments. Our current comment policy is here.