
The latest update to the widely referred-to series "Household-debt-to-disposable-income" has been released and that shows it stable at 168%.
It has been at that level for four straight quarters, and is a record high. It is the source of public angst. Its most quoted source is here.
But actually, it is not as dire as it is sometimes made out to be.
The data is used as evidence about how stressed households are under the load of housing debt. It is often compared to similar metrics in other countries* to confirm how elevated this stress is in New Zealand.
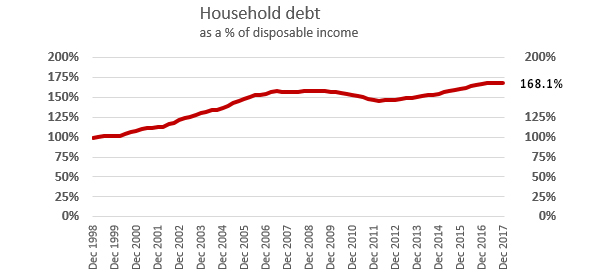
However, many readers may not realise the debt figure includes property investment debt and not just owner-occupier housing debt. That extra debt is in there because it is not possible to separate out the liabilities of these unincorporated businesses from standard household finances.
This distorts the understanding of what this 'household' data is revealing.
And there is another issue, one glossed over by many. The 168% is seen as a proxy for household budget stress. But household budgets don't use their 'income' to purchase houses. They actually use their income to make loan payments, mainly for interest. Real stress will come when these loan payments eat up increasing proportions of disposable incomes.
But not only is that not occurring, the load is getting lighter. The optics of the debt-to-income ratio may look bad, but inside households themselves, the debt-servicing-to-income ratio gives a completely different picture.
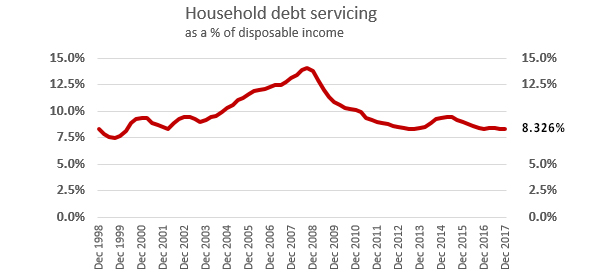
So, even after including the national business liabilities of household ownership of rental properties, the servicing load on household budgets is near its lowest level in 17 years.
The servicing load rose from 1999 to 2008, and has been generally in decline since, and by the end of 2017 reached its lowest point since 1999.
This is a narrative quite at odds with the normal public discussion about household debt levels.
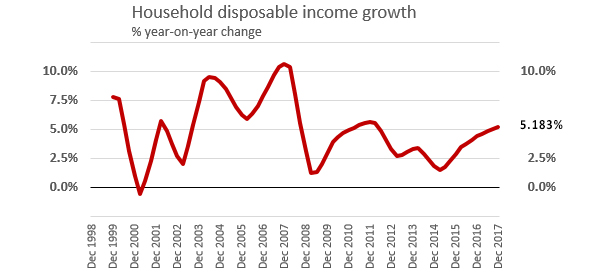
One reason why the servicing load is getting easier is that incomes are rising steadily, and the rate has been increasing in the past three years.
Another point worth noting is that household liabilities are not only for housing; they include consumer loans as well.
| Household debt stress | Dec-2007 | Dec-2012 | Dec-2017 |
| $ bln | $ bln | $ bln | |
| Consumer loans (C22) | 13.9 | 12.9 | 16.5 |
| Housing loans - owner occupier (C22) | 110.0 | 126.8 | 175.5 |
| Housing loans - investment properties | 54.6 | 64.1 | 84.3 |
| ------------------------------------ | --------- | --------- | --------- |
| Total household debt (C21) | 178.5 | 203.8 | 276.3 |
| - Household debt to disposable income ratio | 156.7% | 147.2% | 168.1% |
| - same ratio excluding investment properties | 108.8% | 100.9% | 116.8% |
| Annual household disposable income | 113.9 | 138.4 | 164.4 |
| Annual household debt servicing | 14.5 | 12.0 | 13.7 |
| - Debt servicing to household income ratio, for qtr ending | 13.105% | 8.525% | 8.326% |
This table points out clearly how much lower the servicing load is at the end of 2017 than it was ten years ago.
As a marker for household debt stress we should talk more about the servicing ratio rather than the debt-to-income ratio. The servicing ratio is the pointy end of where we will observe real stress, whereas the debt-to-income ratio is academic.
* The ability to borrow against Australian self-managed superannuation funds has pushed their ratio to almost 200%.
We welcome your comments below. If you are not already registered, please register to comment
Remember we welcome robust, respectful and insightful debate. We don't welcome abusive or defamatory comments and will de-register those repeatedly making such comments. Our current comment policy is here.