
By David Chaston
We recently highlighted the rising share wages are as a proportion of national income (GDP).
There has been a clear improvement since 2000 with a brief hesitation during the height of the GFC.
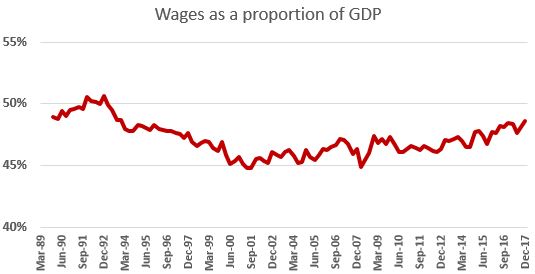
Chart 1
We also showed that rising participation rates are likely to be behind the shift. And it is the female participation in the workforce that is driving that.
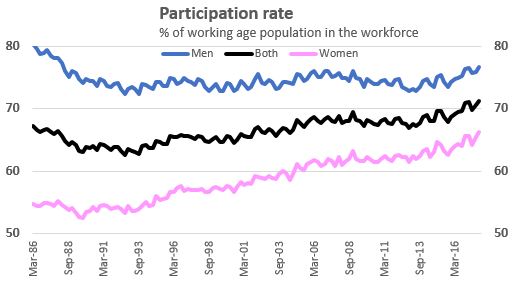
Chart 2
In other words, more women in the workforce is helping driving our rise in GDP, but that may be restraining our rise in per capita GDP.
We also know that women are on average paid much less than men. In fact, the difference is embarrassingly large even if it isn't getting larger. In a $284 billion economy, women appear to be paid $25.5 bln less than men.
In other words, if the average pay was the same, our economy would be 9% larger, ignoring the multiplier effects - and likely very much larger with the normal multiplier impacts.
That $25.5 bln is after equalising the unemployment differences between men and women, equalising the participation rate, and equalising the population differences. On a raw basis, and not equalising for those factors, the difference is $31.9 bln.
| as at Dec 2017 | Men | Women | Women | Women | Women | Women | |
| actual | actual | at male popn | at male PR | at male UR | at male pay | ||
| Working age | 1,877,400 | 1,965,800 | 1,877,400 | 1,877,400 | 1,877,400 | 1,877,400 | |
| Labour force | 1,439,400 | 1,301,200 | 1,242,686 | 1,439,400 | 1,439,400 | 1,439,400 | |
| Participation rate | 76.7% | 66.2% | 66.2% | 76.7% | 76.7% | 76.7% | |
| Unemployed | 57,700 | 63,400 | 60,549 | 70,134 | 57,700 | 57,700 | |
| Employed | 1,381,700 | 1,237,800 | 1,182,137 | 1,369,266 | 1,381,700 | 1,381,700 | |
| Average weekly wage $* | $1208.05 | $853.32 | $853.32 | $853.32 | $853.32 | $1208.05 | |
| Total pay in NZ$ bln pa | $86.796 | $54.924 | $52.455 | $60.758 | $61,310 | $86.796 | |
| Difference NZ$ bln | $31.9 | ( $2.5 ) | $8.3 | $0.6 | $25.5 | ||
| cumulative | ( $2.5 ) | $5.8 | $6.4 | $31.9 | |||
* These are the actual averages, mixing part-time and full-time work. The full-time equivalent pay averages are $1285.74 for men and $1047.46 for women.
Participation data is available back to 1986, which allows us to track the experience of various generations over time. For those currently nearing retirement, women made modest gains in participation, and from ages 35 to 50 they won a larger share of employment even as men lost share.The differences are very large, but they are getting smaller. And the improvement is happening relatively quickly.
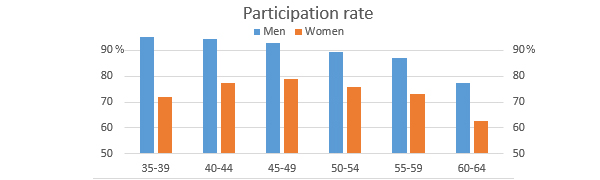
Chart 3
For those entering the workforce in 1987, the differences are also unacceptably large, but they are closing even faster.
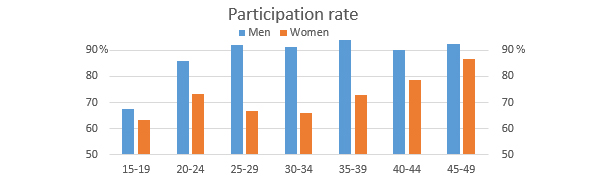
Chart 4
The best way to see this improvement is to the 35-49 cohorts, which are the only common ones in the two sets.
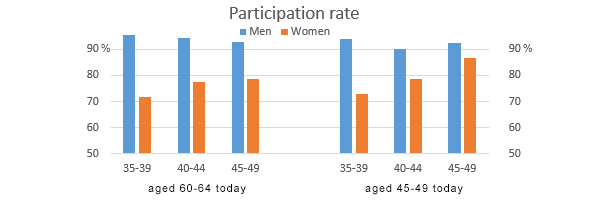
Chart 5
The one thing Chart 4 shows is that women are now participating in the workforce at 'only' 11% less than men at age 45-49 and that is now the closest they have ever been. But in the years leading up to that age, when authority and responsibility peak, they still lag men by over 20%. This is the time when work experience builds and managerial reputations are won.
But even so, with participation rates well over 70% (which is far higher than such rates in Australia, the USA and Europe during those ages) there seems little justification for using participation as a reason why there is not a sufficient talent pool from which to choose.
An important variable not considered here is the nature of the work being done. We will leave that analysis for another day; it is fraught enough for a man to analyse this data and suggest what it means, especially as the data does appear to show reasonably rapid generational improvement.
One data item mentioned above is that the pay differences are closing "relatively quickly". On a full average basis, they have closed from 63% in 1995 to 71.3% today. On a full-time equivalent basis they have closed from 73.7% to 81.4% today over the same period.
But the brutal fact is that "relatively quickly" is nowhere near fast enough. At this rate of improvement, women are going to have to wait until 2070 for equality on this basis.
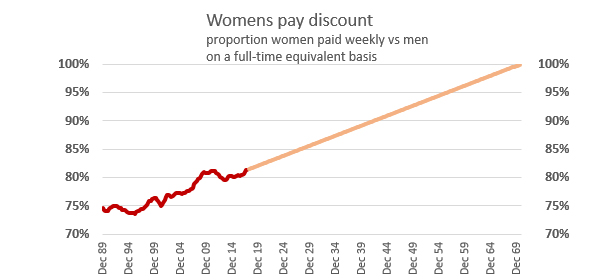
That is clearly an unreasonably long wait. We need to speed the process somehow, even if some adjustments need to be taken into account for lower participation rates, and fractured experience and job development progress during the ages from 25-40.
We welcome your comments below. If you are not already registered, please register to comment
Remember we welcome robust, respectful and insightful debate. We don't welcome abusive or defamatory comments and will de-register those repeatedly making such comments. Our current comment policy is here.