

The housing market is probably slightly hotter at the top end than the lower end, according to the latest data from the Real Estate Institute of New Zealand.
The REINZ national median selling price was up by a whopping 5.2% in the month of October, and up by 19.8% compared to 12 months earlier.
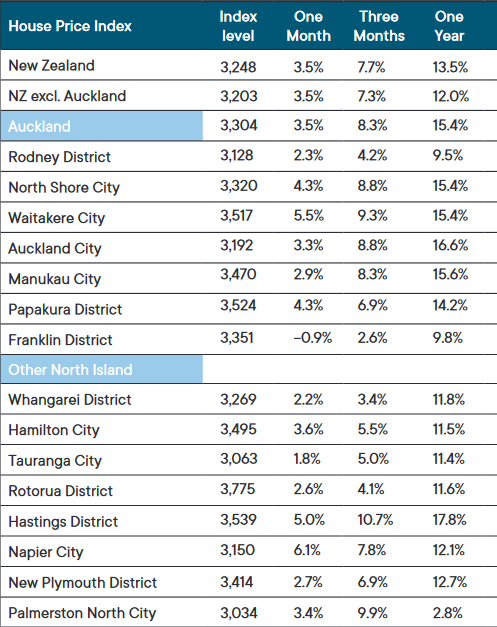
However the REINZ's House Price Index (HPI), which is considered the more reliable indicator of overall market movements, only increased by 3.5% and 13.5% respectively for the same periods, suggesting price growth was lower than the REINZ's medians indicated.
A similar trend was evident in Auckland, with the October median up by 4.7% in the month of October and up 16.3% over the previous 12 months, while the HPI for Auckland was up 3.5% and 15.4% for the same periods.
Why the differences?
The most likely explanation is that while median prices can be a good indication of movements in the market, they can also be affected by changes in the mix of properties sold.
So if more properties were being sold at the top end of the market than the bottom, that could pull up the median, even though the prices of individual properties might not have moved much.
And vice versa.
But the HPI adjusts for movements in the mix of properties being sold, to give a better indication of overall market movements.
Although the HPI shows lower price movements than the medians over both one and 12 months, it still suggests that prices have been heading skywards at a significant clip.
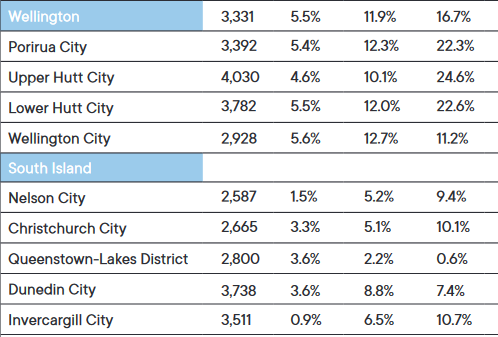
The biggest price increases over the last year have occurred in the Wellington region, with the HPI up by more than 20% in Lower Hutt, Upper Hutt and Porirua over the 12 months to October, while the HPI for Wellington City increased by a comparatively sedate 11.2% over the same period.
That rate of growth appears to be increasing, with the HPI up by more than 5% in the month of October in most parts of Wellington (refer table below for the full regional figures).
It was probably no surprise that the weakest 12 month HPI growth was in Queenstown-Lakes but perhaps just as surprisingly, it was in positive territory, with a 0.6% increase for the year and 3.6% growth in October (see below).
The comment stream on this story is now closed.
REINZ House Price Index - October 2020
We welcome your comments below. If you are not already registered, please register to comment
Remember we welcome robust, respectful and insightful debate. We don't welcome abusive or defamatory comments and will de-register those repeatedly making such comments. Our current comment policy is here.