
| Interest.co.nz Indicative Gross Rental Yield Report | ||||||||||
| Q1 2023 |
There's good news and bad news for residential property investors in interest.co.nz's latest indicative rental yield figures.
The good news is gross rental yields have risen significantly between the first quarter of last year and the first quarter of this year, improving the relative attractiveness of residential property as an investment.
The bad news is the yields are still terrible, meaning investors are likely to struggle to find a residential investment property capable of providing them with a reasonable income stream.
The yields are calculated using the Real Estate Institute of New Zealand's lower quartile selling prices for the three main property types popular with investors - three bedroom houses/two bedroom units/apartments and one bedroom units/apartments - in each of the 27 main urban districts throughout the country and all 11 Auckland Council wards.
These are then matched with quarterly bond data from Tenancy Services, for the same property types and locations.
That provides an indicative gross yield figure, a residential yield is a property's annual rent expressed as a percentage of its purchase price, which allows an apples-with-apples comparison of the relative attractiveness of investing in residential property by property types and locations.
The indicative yields for each property type/location for each of the five quarters from the first quarter (Q1) 2022 to Q1 2023 are shown in table 2 at the bottom of this page.
The overwhelming trend across most locations and property types is yields have been steadily rising over that period, driven by falling prices and rising rents.
In simple terms that means the income earning potential of rental properties has improved over that period.
On a national basis the indicative yield on a three bedroom house has increased from 4.7% in the first quarter of last year to 5.7% in the first quarter this year, while the indicative yield for a two bedroom apartment/unit has increased from 5.7% to 6.8% over the same period.
However, although the yields are improving, in most cases they would probably still be too low to provide investors with a reasonable income stream.
Table 1 below shows the major expenses investors would be likely to face if they purchased a two bedroom unit/apartment at the REINZ's national lower quartile price in the first quarter of this year, compared with the first quarter of last year.
Over that period the price dropped by $50,000, from $480,000 to $430,000, while the median rent increased by $35 a week, rising from $525 a week to $560, pushing the yield up from 5.7% to 6.8%.
Assuming the property was purchased with a 40% deposit, the size of the mortgage needed also declined, from $280,000 to $258,000, while the average two year fixed mortgage rate increased from 4.20% to 6.45% over the same period.
The higher interest rates pushed annual mortgage payments up from $16,848 to $19,422. And once rates and insurance are paid for, the net rental income that's left for the investor would have been $5424 in Q1 last year, dropping to $4364 in Q1 this year, and that's before allowing for any maintenance costs or periods of vacancy.
Those returns could be described in one word - terrible.
They are so low that any significant period of vacancy or unexpected expense would be likely to push the investor into a negative cash flow situation, where the rental income would be insufficient to cover the property's outgoings. And they would have to be dipping into savings or another source of cash to cover those costs.
Which is probably why residential property purchases by investors are steadily drying up.
The graph below shows the number of mortgages approved to residential property investors each month from August 2014 to April 2023.
According to the Reserve Bank, the number of mortgage approvals for residential property investors declined by 70% between the first quarter of 2015 and the first quarter of 2023, from 14,600 to 4392.
This is probably also why there is so much emphasis by investors on property prices and the potential for, or lack of, capital gains.
With yields so low it is probably the only way they can make money from a potential investment.
Some will still be looking for income returns over the long term. But the latest figures suggest their investment horizon would need to be a very long one for that strategy to succeed.
At current fundamentals, the days of mum and dad buying themselves a little rental unit to provide them with a decent retirement income may be drawing to a close.
The way things stand at the moment, they would probably be better off keeping their money in the bank or looking at another alternative to residential rental property.
The comment stream on this story is now closed.
Table 1:
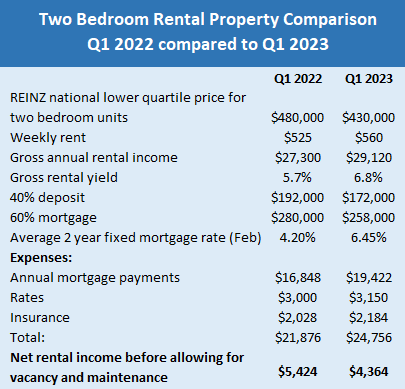
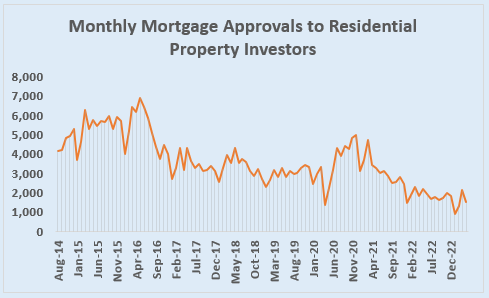
Table 2:

| Quarter | 3 brm house | 1 brm unit | 2 brm unit |
| Whangarei District | |||
| Q1 2022 | 4.5% | 7.3% | 4.9% |
| Q2 2022 | 4.9% | 6.2% | 5.1% |
| Q3 2022 | 4.9% | 7.1% | 5.2% |
| Q4 2022 | 5.0% | 8.4% | 5.3% |
| Q1 2023 | 5.2% | 7.0% | 5.3% |
| Auckland Region | |||
| Q1 2022 | 3.5% | 6.2% | 4.4% |
| Q2 2022 | 3.7% | 13.6% | 4.5% |
| Q3 2022 | 3.9% | 7.2% | 4.6% |
| Q4 2022 | 4.0% | 11.2% | 4.8% |
| Q1 2023 | 4.2% | 11.8% | 5.3% |
| Auckland - Rodney Ward | |||
| Q1 2022 | 3.5% | ||
| Q2 2022 | 3.5% | ||
| Q3 2022 | 3.9% | ||
| Q4 2022 | 3.7% | ||
| Q1 2023 | 3.5% | ||
| Auckland - Albany Ward | |||
| Q1 2022 | 3.2% | 4.1% | 3.4% |
| Q2 2022 | 3.4% | 4.5% | 3.6% |
| Q3 2022 | 3.6% | 3.8% | 3.8% |
| Q4 2022 | 3.7% | 4.2% | 4.3% |
| Q1 2023 | 3.9% | 5.1% | 4.5% |
| Quarter | 3 brm house | 1 brm unit | 2 brm unit |
| Auckland - North Shore Ward | |||
| Q1 2022 | 3.1% | 3.9% | 3.5% |
| Q2 2022 | 3.3% | 4.2% | 3.9% |
| Q3 2022 | 3.4% | 4.6% | 4.1% |
| Q4 2022 | 3.5% | 4.2% | 4.1% |
| Q1 2023 | 3.7% | 6.0% | 4.1% |
| Auckland - Waitakere Ward | |||
| Q1 2022 | 3.3% | 3.4% | |
| Q2 2022 | 3.6% | 3.6% | |
| Q3 2022 | 3.7% | 4.8% | |
| Q4 2022 | 3.8% | 4.1% | |
| Q1 2023 | 4.0% | 4.7% | |
| Auckland - Waitemata and Gulf Ward | |||
| Q1 2022 | 2.8% | 9.1% | 10.6% |
| Q2 2022 | 2.9% | 26.4% | 10.0% |
| Q3 2022 | 2.6% | 16.5% | 10.4% |
| Q4 2022 | 2.8% | 24.2% | 9.9% |
| Q1 2023 | 2.9% | 19.4% | 10.5% |
| Auckland - Whau Ward | |||
| Q1 2022 | 3.2% | 5.3% | 4.5% |
| Q2 2022 | 3.3% | 6.5% | 4.0% |
| Q3 2022 | 3.5% | 3.3% | 4.2% |
| Q4 2022 | 3.7% | 4.6% | 4.1% |
| Q1 2023 | 4.0% | 5.1% | |
| Quarter | 3 brm house | 1 brm unit | 2 brm unit |
| Auckland - Albert-Eden-Puketapapa Ward | |||
| Q1 2022 | 2.9% | 4.2% | 4.0% |
| Q2 2022 | 3.1% | 4.2% | 3.9% |
| Q3 2022 | 3.2% | 4.9% | 4.1% |
| Q4 2022 | 3.1% | 4.7% | 4.5% |
| Q1 2023 | 3.4% | 5.0% | 4.9% |
| Auckland - Orakei Ward | |||
| Q1 2022 | 2.5% | 5.3% | 3.4% |
| Q2 2022 | 2.8% | 4.5% | 3.5% |
| Q3 2022 | 2.7% | 6.7% | 3.6% |
| Q4 2022 | 3.1% | 6.4% | 3.8% |
| Q1 2023 | 3.3% | 7.8% | 4.4% |
| Auckland - Maungakiekie-Tamaki Ward | |||
| Q1 2022 | 2.9% | 4.1% | 5.0% |
| Q2 2022 | 3.3% | 5.2% | 4.3% |
| Q3 2022 | 2.3% | 5.5% | 3.1% |
| Q4 2022 | 3.6% | 5.5% | 4.4% |
| Q1 2023 | 3.8% | 8.4% | 4.7% |
| Auckland - Howick Ward | |||
| Q1 2022 | 3.0% | 4.6% | 4.0% |
| Q2 2022 | 3.4% | 3.9% | |
| Q3 2022 | 3.2% | 5.3% | 4.6% |
| Q4 2022 | 3.4% | 5.1% | 4.0% |
| Q1 2023 | 3.5% | 5.0% | 4.4% |
| Quarter | 3 brm house | 1 brm unit | 2 brm unit |
| Auckland - Manukau Ward | |||
| Q1 2022 | 3.8% | 5.1% | 4.1% |
| Q2 2022 | 4.0% | 5.5% | 4.3% |
| Q3 2022 | 4.3% | 5.4% | 5.1% |
| Q4 2022 | 4.5% | 5.5% | 4.7% |
| Q1 2023 | 4.6% | 6.0% | 5.0% |
| Auckland - Manurewa-Papakura Ward | |||
| Q1 2022 | 3.8% | 3.9% | |
| Q2 2022 | 4.1% | 4.2% | |
| Q3 2022 | 4.2% | 4.2% | |
| Q4 2022 | 4.5% | 4.8% | |
| Q1 2023 | 4.8% | 4.9% | |
| Auckland - Franklin Ward | |||
| Q1 2022 | 3.8% | 4.3% | 3.5% |
| Q2 2022 | 3.7% | ||
| Q3 2022 | 4.0% | 4.1% | |
| Q4 2022 | 4.1% | ||
| Q1 2023 | 4.3% | ||
| Hamilton City | |||
| Q1 2022 | 3.8% | 3.6% | 4.6% |
| Q2 2022 | 4.0% | 4.5% | 4.5% |
| Q3 2022 | 4.3% | 4.8% | 4.6% |
| Q4 2022 | 4.5% | 4.0% | 4.6% |
| Q1 2023 | 4.5% | 3.2% | 4.8% |
| Quarter | 3 brm house | 1 brm unit | 2 brm unit |
| Taupo District | |||
| Q1 2022 | 3.9% | 4.6% | |
| Q2 2022 | 3.8% | 3.4% | |
| Q3 2022 | 4.1% | 3.7% | |
| Q4 2022 | 3.9% | 0.0% | |
| Q1 2023 | 4.6% | 4.3% | |
| Tauranga City | |||
| Q1 2022 | 3.8% | 3.6% | 4.7% |
| Q2 2022 | 4.1% | 3.4% | 4.4% |
| Q3 2022 | 4.4% | 2.7% | 4.7% |
| Q4 2022 | 4.6% | 8.4% | 4.5% |
| Q1 2023 | 4.5% | 5.7% | 5.0% |
| Rotorua District | |||
| Q1 2022 | 5.2% | 5.8% | |
| Q2 2022 | 5.2% | 5.7% | |
| Q3 2022 | 5.5% | 1.9% | 7.9% |
| Q4 2022 | 5.6% | 2.8% | 5.4% |
| Q1 2023 | 6.4% | 6.5% | |
| Whakatane District | |||
| Q1 2022 | 4.2% | ||
| Q2 2022 | 4.2% | ||
| Q3 2022 | 4.5% | ||
| Q4 2022 | 5.2% | ||
| Q1 2023 | 5.3% | ||
| Quarter | 3 brm house | 1 brm unit | 2 brm unit |
| Hastings District | |||
| Q1 2022 | 4.7% | 4.4% | |
| Q2 2022 | 4.7% | 5.1% | |
| Q3 2022 | 5.0% | 0.0% | |
| Q4 2022 | 5.2% | 5.0% | |
| Q1 2023 | 5.5% | 5.5% | |
| Napier City | |||
| Q1 2022 | 4.1% | 7.0% | 5.4% |
| Q2 2022 | 4.6% | 7.7% | 5.7% |
| Q3 2022 | 4.7% | 7.4% | 5.6% |
| Q4 2022 | 4.8% | 5.0% | |
| Q1 2023 | 5.2% | 6.9% | |
| New Plymouth District | |||
| Q1 2022 | 4.7% | 4.4% | |
| Q2 2022 | 5.0% | 5.3% | |
| Q3 2022 | 5.1% | 5.3% | |
| Q4 2022 | 5.2% | 6.1% | |
| Q1 2023 | 5.5% | 7.2% | |
| Whanganui District | |||
| Q1 2022 | 5.2% | 6.8% | 4.8% |
| Q2 2022 | 5.3% | 4.8% | |
| Q3 2022 | 6.1% | 6.0% | 5.1% |
| Q4 2022 | 6.3% | 9.7% | 6.8% |
| Q1 2023 | 6.3% | 8.3% | 7.2% |
| Quarter | 3 brm house | 1 brm unit | 2 brm unit |
| Palmerston North City | |||
| Q1 2022 | 4.6% | 4.3% | |
| Q2 2022 | 4.9% | 4.9% | |
| Q3 2022 | 5.3% | 5.7% | |
| Q4 2022 | 5.3% | 6.8% | |
| Q1 2023 | 5.7% | 6.2% | |
| Kapiti Coast District | |||
| Q1 2022 | 4.0% | ||
| Q2 2022 | 4.4% | ||
| Q3 2022 | 4.4% | ||
| Q4 2022 | 4.4% | ||
| Q1 2023 | 4.8% | ||
| Porirua City | |||
| Q1 2022 | 4.3% | ||
| Q2 2022 | 4.8% | ||
| Q3 2022 | 5.4% | ||
| Q4 2022 | 4.9% | ||
| Q1 2023 | 5.0% | ||
| Upper Hutt City | |||
| Q1 2022 | 4.4% | ||
| Q2 2022 | 4.7% | ||
| Q3 2022 | 4.9% | 5.6% | |
| Q4 2022 | 5.2% | 6.3% | |
| Q1 2023 | 5.6% | 5.7% | |
| Quarter | 3 brm house | 1 brm unit | 2 brm unit |
| Lower Hutt City | |||
| Q1 2022 | 4.3% | 4.5% | 4.5% |
| Q2 2022 | 4.7% | 5.5% | 5.3% |
| Q3 2022 | 5.2% | 7.4% | 6.2% |
| Q4 2022 | 5.6% | 10.5% | 6.4% |
| Q1 2023 | 5.8% | 6.6% | 7.1% |
| Wellington City | |||
| Q1 2022 | 4.1% | 6.3% | 5.0% |
| Q2 2022 | 4.3% | 6.2% | 5.4% |
| Q3 2022 | 4.6% | 7.1% | 6.1% |
| Q4 2022 | 4.8% | 8.4% | 5.4% |
| Q1 2023 | 4.9% | 7.8% | 6.4% |
| Nelson City | |||
| Q1 2022 | 4.2% | 6.0% | 4.4% |
| Q2 2022 | 4.2% | 6.0% | 4.6% |
| Q3 2022 | 4.5% | 6.5% | 5.9% |
| Q4 2022 | 4.6% | 6.4% | 6.2% |
| Q1 2023 | 4.7% | 4.7% | 5.7% |
| Marlborough District | |||
| Q1 2022 | 4.3% | ||
| Q2 2022 | 4.2% | ||
| Q3 2022 | 5.0% | ||
| Q4 2022 | 4.5% | ||
| Q1 2023 | 4.9% | ||
| Quarter | 3 brm house | 1 brm unit | 2 brm unit |
| Waimakariri District | |||
| Q1 2022 | 4.3% | ||
| Q2 2022 | 4.2% | ||
| Q3 2022 | 4.4% | ||
| Q4 2022 | 4.3% | ||
| Q1 2023 | 4.8% | ||
| Christchurch City | |||
| Q1 2022 | 4.3% | 4.9% | 5.4% |
| Q2 2022 | 4.6% | 6.2% | 5.7% |
| Q3 2022 | 4.7% | 5.6% | 5.5% |
| Q4 2022 | 4.9% | 5.4% | 5.8% |
| Q1 2023 | 5.1% | 5.8% | 6.4% |
| Selwyn District | |||
| Q1 2022 | 3.9% | ||
| Q2 2022 | 3.9% | ||
| Q3 2022 | 4.0% | ||
| Q4 2022 | 4.4% | ||
| Q1 2023 | 4.2% | ||
| Ashburton District | |||
| Q1 2022 | 4.7% | ||
| Q2 2022 | 5.0% | ||
| Q3 2022 | 5.3% | ||
| Q4 2022 | 4.8% | ||
| Q1 2023 | 5.0% | ||
| Quarter | 3 brm house | 1 brm unit | 2 brm unit |
| Timaru District | |||
| Q1 2022 | 5.1% | 6.4% | |
| Q2 2022 | 4.8% | 6.3% | |
| Q3 2022 | 5.2% | 5.3% | |
| Q4 2022 | 5.6% | 6.1% | |
| Q1 2023 | 5.4% | 6.6% | |
| Queenstown-Lakes District | |||
| Q1 2022 | 3.2% | 4.4% | 4.1% |
| Q2 2022 | 3.3% | 4.8% | 4.8% |
| Q3 2022 | 3.6% | 7.4% | 4.3% |
| Q4 2022 | 3.8% | 4.8% | 4.7% |
| Q1 2023 | 3.9% | 8.8% | 5.0% |
| Dunedin City | |||
| Q1 2022 | 4.7% | 5.0% | 6.4% |
| Q2 2022 | 4.8% | 4.3% | 5.6% |
| Q3 2022 | 5.4% | 4.6% | 6.0% |
| Q4 2022 | 5.6% | 4.2% | 7.4% |
| Q1 2023 | 5.9% | 5.8% | 6.6% |
| Invercargill City | |||
| Q1 2022 | 5.9% | 6.1% | |
| Q2 2022 | 6.1% | 7.0% | |
| Q3 2022 | 6.0% | 6.8% | |
| Q4 2022 | 6.0% | 7.3% | |
| Q1 2023 | 6.8% | 6.4% | |
| Quarter | 3 brm house | 1 brm unit | 2 brm unit |
| All of Aotearoa | |||
| Q1 2022 | 4.7% | 6.4% | 5.7% |
| Q2 2022 | 4.9% | 7.8% | 5.7% |
| Q3 2022 | 5.2% | 6.9% | 6.2% |
| Q4 2022 | 5.3% | 9.7% | 6.3% |
| Q1 2023 | 5.7% | 10.2% | 6.8% |
| --------------------------------------------------------- | |||
| The price data used to calculate the yield figures in this report is provided by the Real Estate Institute of New Zealand (REINZ), home of the most complete, accurate and up-to-date real estate data in New Zealand. | |||
- You can have articles like this delivered directly to your inbox via our free Property Newsletter. We send it out 3-5 times a week with all of our property-related news, including auction results, interest rate movements and market commentary and analysis. To start receiving them, register here (it's free) and when approved you can select any of our free email newsletters.
We welcome your comments below. If you are not already registered, please register to comment
Remember we welcome robust, respectful and insightful debate. We don't welcome abusive or defamatory comments and will de-register those repeatedly making such comments. Our current comment policy is here.