
 By Bernard Hickey
I was speaking last week at an Auckland University seminar on the housing market and someone raised the issue of housing affordability back during the previous booms of 1975 and 1987 when interest rates were higher and incomes were lower. (Correcting details for 1987 mortgage payments, adding details on wage inflation)
I get this quite a lot. Baby boomers and those even older say that the youth of today have it much easier than when they were buying homes. They point to the amazing housing boom of 1974 and the 20% interest rates of 1987 and say that people buying today 'have it lucky'.
I had my doubts about this so we at interest.co.nz did some research on housing affordability now and then. We have gathered data on wages, after tax incomes, house prices and interest rates (from Stats NZ, IRD and the RBNZ) to work out how much the median or average house cost in 1975, 1987 and 2009 as a percentage of a single average after tax pay.
We found it was vastly more affordable to buy in 1975 than in 2009. The gap was vast. Affordability was almost as bad in 1987 as it was at the peak of the boom in 2007, but only for a short period. Here is the detail below.
Way back in 1975 - 39.2% of income
An explosion of credit globally after the end of the gold standard (Nixon) and heavy US deficit spending (Vietnam) pumped up asset prices around the world. The jump in the oil price after the Arab oil embargo also boosted our commodity prices and, at least temporarily, increased our terms of trade.
By Bernard Hickey
I was speaking last week at an Auckland University seminar on the housing market and someone raised the issue of housing affordability back during the previous booms of 1975 and 1987 when interest rates were higher and incomes were lower. (Correcting details for 1987 mortgage payments, adding details on wage inflation)
I get this quite a lot. Baby boomers and those even older say that the youth of today have it much easier than when they were buying homes. They point to the amazing housing boom of 1974 and the 20% interest rates of 1987 and say that people buying today 'have it lucky'.
I had my doubts about this so we at interest.co.nz did some research on housing affordability now and then. We have gathered data on wages, after tax incomes, house prices and interest rates (from Stats NZ, IRD and the RBNZ) to work out how much the median or average house cost in 1975, 1987 and 2009 as a percentage of a single average after tax pay.
We found it was vastly more affordable to buy in 1975 than in 2009. The gap was vast. Affordability was almost as bad in 1987 as it was at the peak of the boom in 2007, but only for a short period. Here is the detail below.
Way back in 1975 - 39.2% of income
An explosion of credit globally after the end of the gold standard (Nixon) and heavy US deficit spending (Vietnam) pumped up asset prices around the world. The jump in the oil price after the Arab oil embargo also boosted our commodity prices and, at least temporarily, increased our terms of trade.
 New Zealand experienced a very sharp rise in house prices and interest rates rose to almost 10%. This was followed by an explosive period of consumer price and wage inflation at the same time as flattish house prices in nominal terms.
We found the average pre-tax income in June 1975 was NZ$126.88 a week. After tax of 22% that left disposable income of NZ$98.97 a week. The average house price in 1975 was NZ$24,300. Assuming a 33% deposit on a 15 year mortgage and the 9.3% variable rate at the time meant an average wage earner had to make a mortgage payment of NZ$38 a week or about 39.2% of disposable income.
This relative unaffordability didn't last long because wage inflation combined with falling real house prices through the late 1970s and early 1980s reduced the portion of disposable income required to buy a house.
Back in 1987 - 18.4% 67% of income
There was also a housing boom back in 1987 as Alan Greenspan took the reins and cut global interest rates to prevent the 1987 stock market crash widening. Our stock market crashed anyway, but we did have a housing boom that lasted for another year or so.
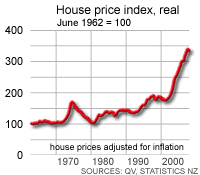
At the same time our interest rates were sky-high to clamp down on inflation which had rampaged through the 1970s and 1980s. The chart above shows the spike in real prices and then the relative decline, despite a blip up in the late 1980s. Real house prices did not recover to their 1975 highs until 1996, thanks to inflation.
Back in 1987 the average house price was NZ$88,900. The average pre-tax income was NZ$485.98 a week and the average take home pay was NZ$365.41. Again, assuming a 33% deposit and a 15 year loan, the mortgage payment of NZ$67.39 NZ$246 a week works out at 18.4% 67.4% of take-home pay. That is even with interest rates at 20.5% as they were at the time.
That proportion quickly fell as interest rates fell to more normal levels in the early 1990s and house prices stagnated.
Fast forward to 2007-09 - 60% to 80% of income
New Zealand experienced a very sharp rise in house prices and interest rates rose to almost 10%. This was followed by an explosive period of consumer price and wage inflation at the same time as flattish house prices in nominal terms.
We found the average pre-tax income in June 1975 was NZ$126.88 a week. After tax of 22% that left disposable income of NZ$98.97 a week. The average house price in 1975 was NZ$24,300. Assuming a 33% deposit on a 15 year mortgage and the 9.3% variable rate at the time meant an average wage earner had to make a mortgage payment of NZ$38 a week or about 39.2% of disposable income.
This relative unaffordability didn't last long because wage inflation combined with falling real house prices through the late 1970s and early 1980s reduced the portion of disposable income required to buy a house.
Back in 1987 - 18.4% 67% of income
There was also a housing boom back in 1987 as Alan Greenspan took the reins and cut global interest rates to prevent the 1987 stock market crash widening. Our stock market crashed anyway, but we did have a housing boom that lasted for another year or so.
At the same time our interest rates were sky-high to clamp down on inflation which had rampaged through the 1970s and 1980s. The chart above shows the spike in real prices and then the relative decline, despite a blip up in the late 1980s. Real house prices did not recover to their 1975 highs until 1996, thanks to inflation.
Back in 1987 the average house price was NZ$88,900. The average pre-tax income was NZ$485.98 a week and the average take home pay was NZ$365.41. Again, assuming a 33% deposit and a 15 year loan, the mortgage payment of NZ$67.39 NZ$246 a week works out at 18.4% 67.4% of take-home pay. That is even with interest rates at 20.5% as they were at the time.
That proportion quickly fell as interest rates fell to more normal levels in the early 1990s and house prices stagnated.
Fast forward to 2007-09 - 60% to 80% of income
 Between 2002 and late 2007 house prices in New Zealand virtually doubled during a period of low inflation. They exploded in real terms as the chart above shows. Alan Greenspan was well entrenched with his low interest rates policy and a new higher tax threshold in New Zealand encouraged much borrowing to buy rental property.
Assuming the same 33% deposit and 15 year home loan, a person on the median income buying the median house now would be receiving NZ$734 after tax and paying NZ$449 in mortgage payments or 61.2% of disposable income.
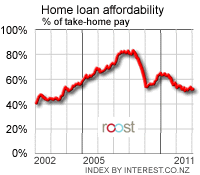
Our regular housing affordability series sponsored by BNZ uses a slightly different set of assumptions. We assume a 20% deposit and a 25 year home loan, which is now the norm. Using these assumptions, the median payment works out at 56.3% now. At the height of the housing boom in November 2007 that percentage rose to over 80%.
This is more than twice the portion of income needed in 1975 and above the 67% needed in 1987.
Wage inflation may not save us
In the mid 1970s and mid 1980s when many homebuyers bought houses and stretched their ability to service those mortgages, they could be confident that wage inflation would dig them out of trouble.
Inflation works wonders to reduce the real value of debt, which is why lenders hate inflation with a passion and why debt prices for fixed interest securities fall and yields rise during periods of high inflation.
But I have my doubts about wage inflation helping reduce debts this time. If anything, inflation is very low and likely to remain low because of the massive excess capacity of labour and machines now built into the global economy. We have already seen wage growth in New Zealand drop sharply.
Between 2002 and late 2007 house prices in New Zealand virtually doubled during a period of low inflation. They exploded in real terms as the chart above shows. Alan Greenspan was well entrenched with his low interest rates policy and a new higher tax threshold in New Zealand encouraged much borrowing to buy rental property.
Assuming the same 33% deposit and 15 year home loan, a person on the median income buying the median house now would be receiving NZ$734 after tax and paying NZ$449 in mortgage payments or 61.2% of disposable income.
Our regular housing affordability series sponsored by BNZ uses a slightly different set of assumptions. We assume a 20% deposit and a 25 year home loan, which is now the norm. Using these assumptions, the median payment works out at 56.3% now. At the height of the housing boom in November 2007 that percentage rose to over 80%.
This is more than twice the portion of income needed in 1975 and above the 67% needed in 1987.
Wage inflation may not save us
In the mid 1970s and mid 1980s when many homebuyers bought houses and stretched their ability to service those mortgages, they could be confident that wage inflation would dig them out of trouble.
Inflation works wonders to reduce the real value of debt, which is why lenders hate inflation with a passion and why debt prices for fixed interest securities fall and yields rise during periods of high inflation.
But I have my doubts about wage inflation helping reduce debts this time. If anything, inflation is very low and likely to remain low because of the massive excess capacity of labour and machines now built into the global economy. We have already seen wage growth in New Zealand drop sharply.
We welcome your comments below. If you are not already registered, please register to comment
Remember we welcome robust, respectful and insightful debate. We don't welcome abusive or defamatory comments and will de-register those repeatedly making such comments. Our current comment policy is here.