
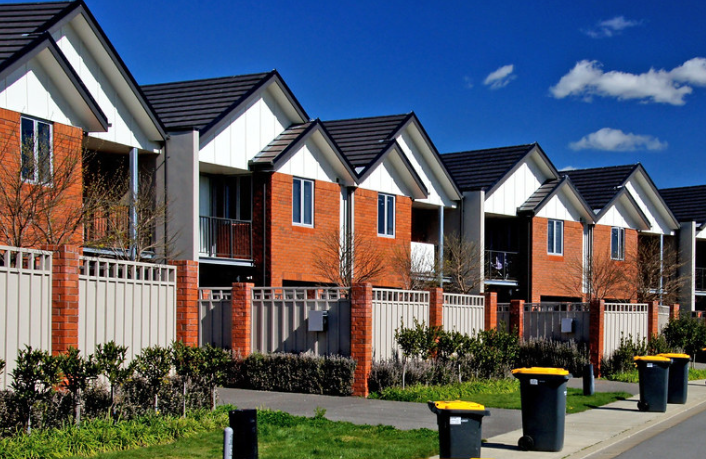
The average value of New Zealand homes continued to increase in February but the rate of value growth is declining, suggesting a possible turn in the market.
According to the CoreLogic House Price Index, the average value of New Zealand homes was $930,495 at the end of February, up from $928,184 in January and $924,489 in December 2023.
However the rate of growth is slowing with the national average value up by just 0.3% in February from 1.6% growth three months earlier.
CoreLogic's housing values are calculated on a three month rolling basis, which means the February figures are based on selling prices over December/January/February, while the January figures are based on selling prices over November/December/January.
The fact that the positive value growth rate has slowed to almost to almost zero suggests there's a strong possibility that average values themselves could start to decline over the next few months, not just the rate of growth, if current market price trends continue.
CoreLogic described the housing market as soft in January and said that trend had extended into February.
"Given that mortgage rates remain high and property sales volumes through January remained at near record lows, buyers and sellers are still taking their time and this is flowing through to more subdued value growth," CoreLogic NZ Chief Property Economist Kelvin Davidson said.
"For new entrants to the housing market, there are still significant challenges in terms of saving the deposit and satisfying loan serviceability criteria."
"Investors are also facing challenges from high mortgage rates too, while even existing owner-occupiers looking to move up the ladder still need to assess their finances closely," Davidson said.
"While the Official Cash Rate remains on hold for now, the risk of further rises in the short term hasn't dissipated altogether, and the likelihood of Official Cash Rate cuts aren't on the table for the foreseeable future either."
"This will mean shorter term fixed mortgage rates, such as the one and two year loan, could remain elevated for a while yet," Davidson said.
The table below shows the latest estimated average dwelling values in all main urban districts and their changes over three and 12 months.
The comment stream on this article is now closed.
| CoreLogic NZ House Price Index | |||
| February 2024 | |||
| Territorial authority | Average current value | 3 month change % | 12 month change % |
| Far North | $700,361 | 1.1% | -1.3% |
| Whangarei | $740,309 | 1.4% | -5.0% |
| Kaipara | $839,619 | 0.9% | -2.6% |
| Auckland - Rodney | $1,250,535 | 0.3% | -3.8% |
| Rodney - Hibiscus Coast | $1,168,892 | 1.3% | -3.1% |
| Rodney - North | $1,316,484 | -0.1% | -4.5% |
| Auckland - North Shore | $1,470,173 | 0.9% | -1.6% |
| North Shore - Coastal | $1,662,887 | 0.1% | -2.9% |
| North Shore - North Harbour | $1,453,550 | 1.4% | 1.9% |
| North Shore - Onewa | $1,182,963 | 1.9% | -2.3% |
| Auckland - Waitakere | $1,011,403 | 1.1% | -3.8% |
| Auckland - City | $1,485,410 | 2.0% | -4.6% |
| Auckland City - Central | $1,261,721 | 0.5% | -5.0% |
| Auckland City - Islands | $1,573,633 | 4.1% | -4.4% |
| Auckland City - South | $1,341,162 | 2.3% | -6.7% |
| Auckland_City - East | $1,852,403 | 2.8% | -3.2% |
| Auckland - Manukau | $1,175,523 | 3.5% | -0.4% |
| Manukau - Central | $906,643 | 5.1% | 0.2% |
| Manukau - East | $1,478,763 | 2.7% | 0.2% |
| Manukau - North West | $1,021,722 | 3.8% | -0.5% |
| Auckland - Papakura | $930,562 | 0.2% | -1.0% |
| Auckland - Franklin | $915,499 | 1.0% | 0.1% |
| Thames Coromandel | $1,148,347 | 0.7% | -2.4% |
| Hauraki | $650,568 | 1.3% | -2.9% |
| Waikato | $761,594 | 5.5% | -2.8% |
| Matamata Piako | $691,627 | 0.1% | -3.2% |
| Hamilton | $809,031 | 0.5% | -2.2% |
| Hamilton - Central & North West | $756,268 | -0.3% | -2.5% |
| Hamilton - North East | $997,234 | 0.6% | -1.7% |
| Hamilton - South East | $749,877 | 1.0% | -1.2% |
| Hamilton - South West | $712,862 | 0.5% | -3.8% |
| Waipa | $872,036 | -1.0% | -0.1% |
| Otorohanga | $528,015 | 0.4% | -6.5% |
| South Waikato | $423,736 | 1.4% | -8.6% |
| Waitomo | $360,481 | 1.5% | -4.4% |
| Taupo | $841,387 | 2.4% | 0.5% |
| Western BOP | $1,003,609 | 0.0% | -0.7% |
| Tauranga | $1,039,689 | 2.7% | -2.9% |
| Rotorua | $639,747 | -1.4% | -3.0% |
| Whakatane | $739,397 | 0.8% | 2.8% |
| Kawerau | $365,790 | -2.1% | -16.2% |
| Opotiki | $495,713 | -3.1% | -9.4% |
| Gisborne | $609,104 | 0.3% | -2.0% |
| Wairoa | $425,619 | 16.3% | 3.1% |
| Hastings | $797,255 | 0.5% | 0.8% |
| Napier | $757,145 | 1.0% | -4.1% |
| Central Hawkes Bay | $592,368 | 1.1% | 0.2% |
| New Plymouth | $714,933 | 2.1% | -1.8% |
| Stratford | $501,676 | 2.8% | 0.7% |
| South Taranaki | $438,470 | 1.1% | -0.2% |
| Ruapehu | $357,481 | -0.6% | -15.4% |
| Whanganui | $509,693 | 2.6% | 1.3% |
| Rangitikei | $425,498 | -1.8% | -4.2% |
| Manawatu | $615,012 | 2.3% | 1.0% |
| Palmerston North | $650,302 | 1.6% | -0.5% |
| Tararua | $422,206 | 6.5% | -0.5% |
| Horowhenua | $565,209 | -1.2% | -3.2% |
| Kapiti Coast | $815,844 | 2.7% | -3.9% |
| Porirua | $841,292 | 0.6% | 2.0% |
| Upper Hutt | $751,897 | 2.8% | -0.9% |
| Hutt | $799,855 | 4.0% | 1.8% |
| Wellington City | $1,029,471 | 0.6% | -0.6% |
| Wellington - Central & South | $983,249 | -0.2% | 1.2% |
| Wellington - East | $1,138,113 | 0.7% | -2.1% |
| Wellington - North | $978,619 | 1.1% | -1.6% |
| Wellington - West | $1,152,689 | -0.2% | -0.1% |
| Masterton | $564,412 | 0.4% | -2.2% |
| Carterton | $632,757 | 2.5% | -5.0% |
| South Wairarapa | $757,026 | 2.0% | -12.7% |
| Tasman | $787,561 | 1.7% | -4.5% |
| Nelson | $783,165 | 1.4% | -3.6% |
| Marlborough | $703,095 | 1.0% | -1.9% |
| Kaikoura | $706,549 | 6.0% | 10.0% |
| Buller | $339,212 | -0.8% | 1.4% |
| Grey | $408,437 | 9.1% | 15.0% |
| Westland | $407,723 | 7.9% | 3.1% |
| Hurunui | $632,158 | 2.0% | 5.3% |
| Waimakariri | $707,284 | 1.1% | 0.2% |
| Christchurch | $758,452 | 1.6% | 1.6% |
| Christchurch - Banks Peninsula | $820,479 | -3.4% | -0.2% |
| Christchurch - Central & North | $863,864 | 2.0% | 1.4% |
| Christchurch - East | $594,474 | 2.3% | 1.1% |
| Christchurch - Hills | $1,058,122 | -0.3% | 1.1% |
| Christchurch - Southwest | $721,235 | 1.8% | 2.8% |
| Selwyn | $836,234 | 1.2% | 1.0% |
| Ashburton | $538,736 | 1.7% | 1.9% |
| Timaru | $525,339 | 1.0% | 0.4% |
| MacKenzie | $780,944 | 5.0% | 8.5% |
| Waimate | $436,017 | 2.6% | 2.1% |
| Waitaki | $480,162 | 4.5% | 0.1% |
| Central Otago | $811,803 | 1.8% | 5.0% |
| Queenstown Lakes | $1,798,059 | 3.8% | 7.8% |
| Dunedin | $636,373 | 1.4% | 0.5% |
| Dunedin - Central & North | $645,996 | 2.5% | -0.2% |
| Dunedin - Peninsular & Coastal | $597,860 | 0.3% | -0.8% |
| Dunedin - South | $598,164 | -0.1% | 1.0% |
| Dunedin - Taieri | $677,490 | 2.3% | 1.3% |
| Clutha | $403,475 | 3.9% | 2.5% |
| Southland | $509,854 | 2.8% | 5.8% |
| Gore | $402,488 | -1.2% | -5.1% |
| Invercargill | $464,753 | 1.4% | 0.0% |
| Auckland Region | $1,291,999 | 1.7% | -3.2% |
| Wellington Region | $915,174 | 1.5% | 0.2% |
| Main Urban Areas | $1,028,744 | 1.8% | -1.8% |
| All of Aotearoa | $930,495 | 1.6% | -1.4% |
•You can have articles like this delivered directly to your inbox via our free Property Newsletter. We send it out 3-5 times a week with all of our property-related news, including auction results, interest rate movements and market commentary and analysis. To start receiving them, register here (it's free) and when approved you can select any of our free email newsletters.
We welcome your comments below. If you are not already registered, please register to comment
Remember we welcome robust, respectful and insightful debate. We don't welcome abusive or defamatory comments and will de-register those repeatedly making such comments. Our current comment policy is here.