

New Zealand's median dwelling value dropped for the sixth consecutive month in September, according to the Cotality Home Value Index.
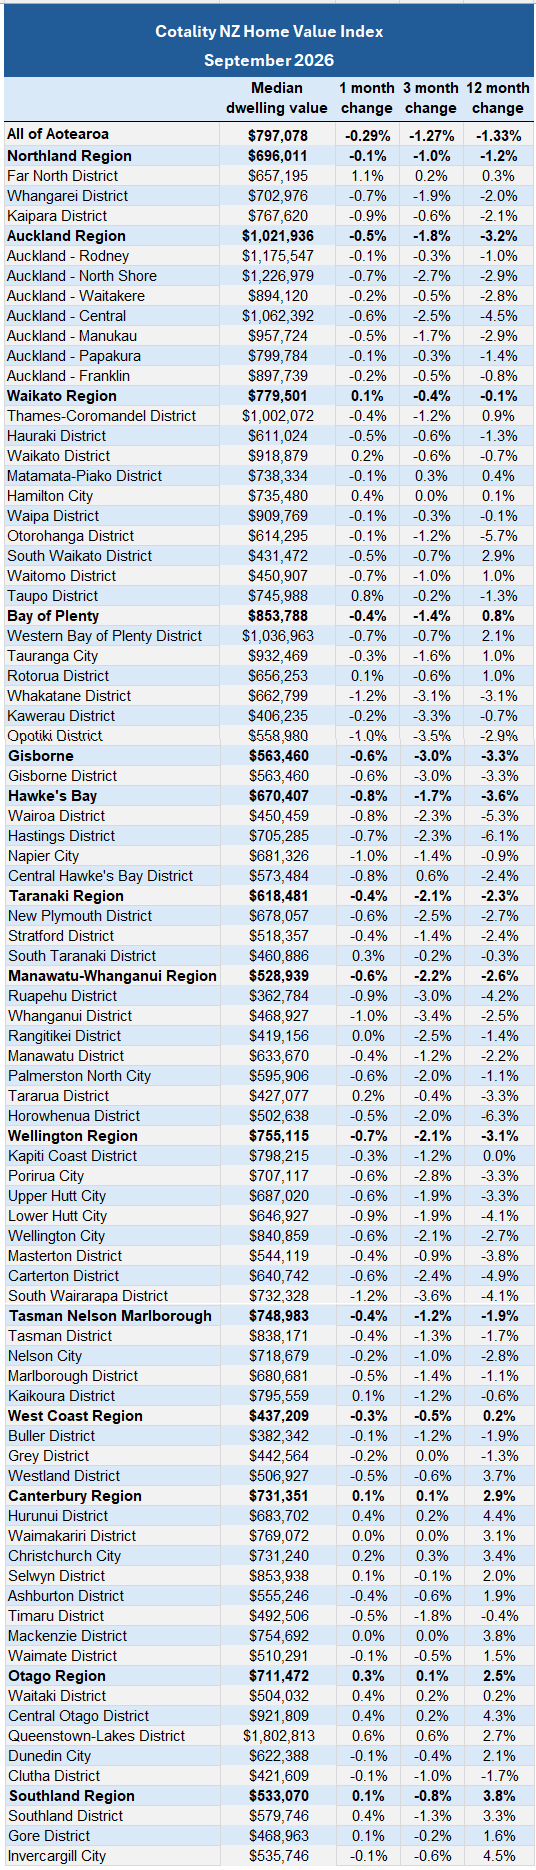
The national median dwelling value was $797,078 in September, and is now 1.33% lower than it was in September last year.
The biggest annual regional decline was in Hawke's Bay at -3.6%, followed by Gisborne -3.3%, Auckland -3.2%, Wellington Region -3.1%, Manawatu-Whanganui -2.6% and Taranaki -2.3%.
The biggest annual regional gains in median values were in Southland 3.8%, Canterbury 2.9% and Otago 2.5%.
Cotality NZ Chief Property Economist Kelvin Davidson said the housing market continued to favour buyers.
"The housing market remains cautious, with buyers still holding most of the negotiating power," Davidson said.
"While many vendors are not being forced to accept significant discounts, purchasers continue to benefit from plentiful choice and little urgency," he said.
Within the Auckland Region - the country's largest housing market - the annual decline in housing values ranged from -0.8% in Franklin on the region's southern border, to -4.5% in central Auckland.
Within the Wellington Region, median values were lower in all regions compared to a year ago, except Kapiti, where they were unchanged.
The biggest annual decline within the Wellington Region was in Carterton at -4.9%, followed by Lower Hutt and South Wairarapa both -4.1%.
In Canterbury the annual median value changes ranged from a gain of 4.4% in Hurunui to -0.4% in Timaru.
The country's most expensive district is Queenstown-Lakes where homes had a median value of $1,802,813 in September, while the lowest median value was in Buller on the West Coast at $382,342.
Buller is the only district in the country to have a median value below $400,000.
The table below shows the changes in median values in all urban districts over one, three and 12 months.
We welcome your comments below. If you are not already registered, please register to comment
Remember we welcome robust, respectful and insightful debate. We don't welcome abusive or defamatory comments and will de-register those repeatedly making such comments. Our current comment policy is here.