

The housing market was a tough place for sellers in October, with sales volumes down almost a quarter year-on-year, according to the Real Estate Institute of New Zealand (REINZ).
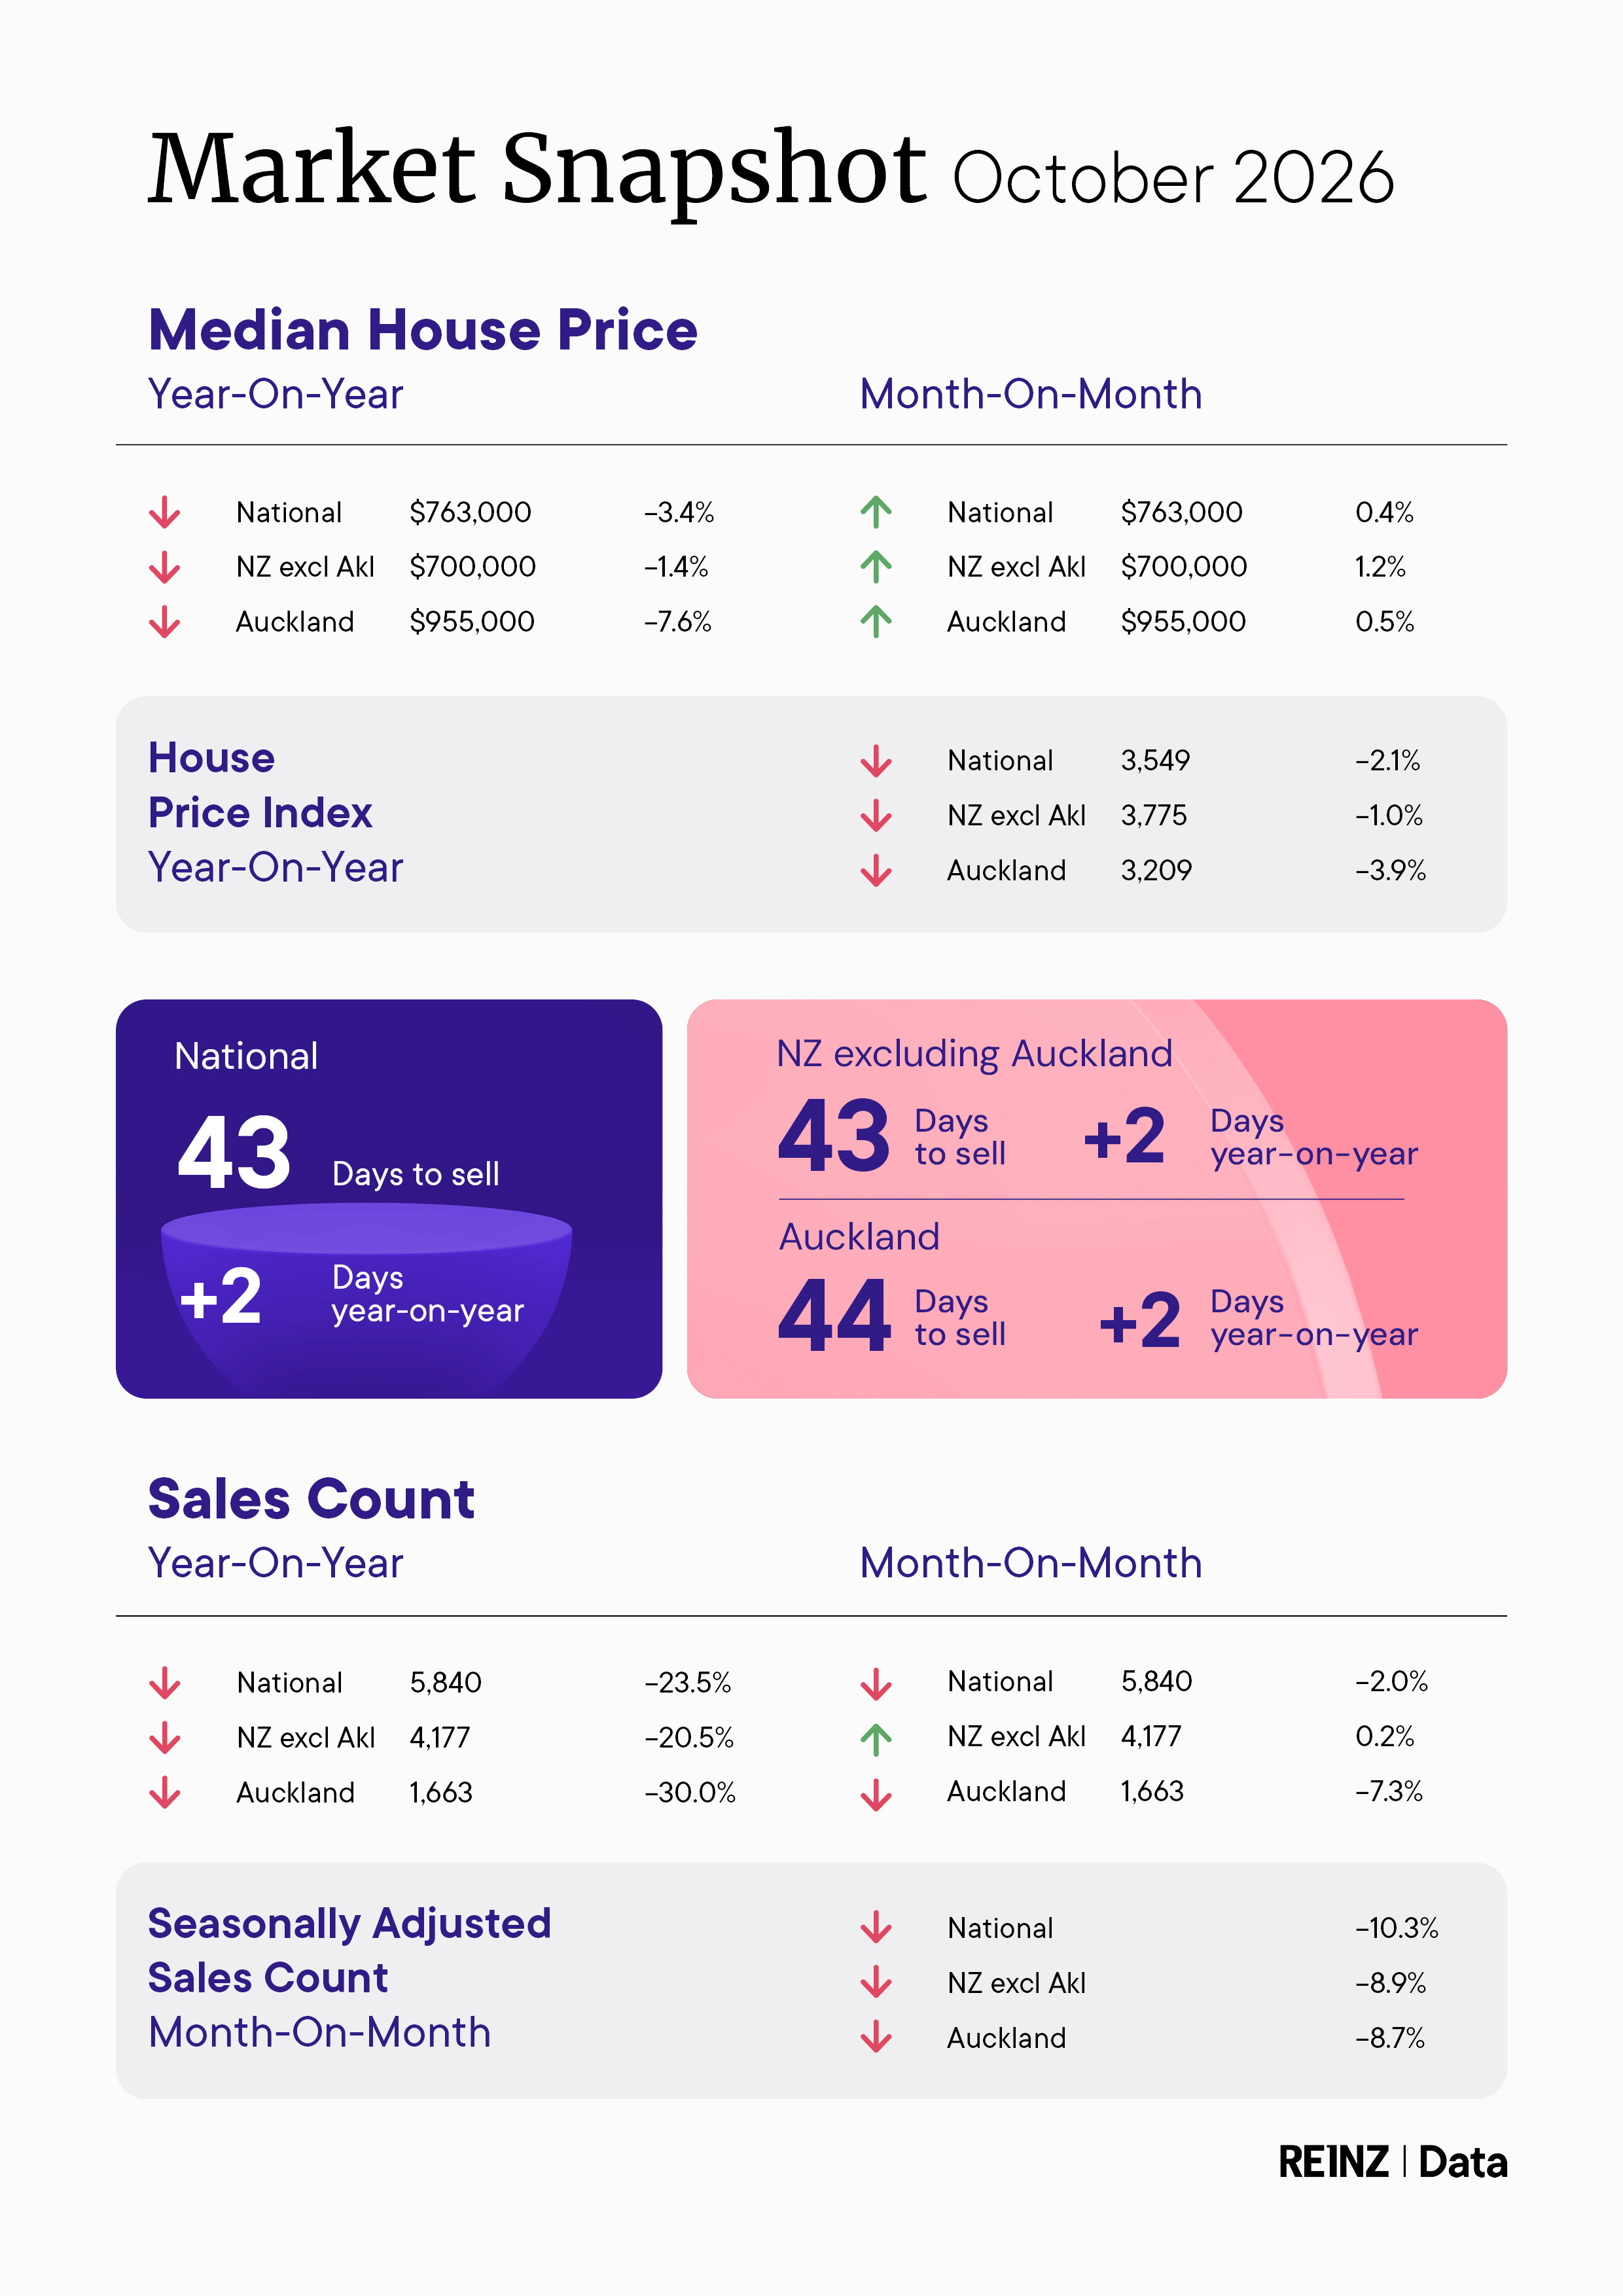
The REINZ recorded 5840 residential property sales in October, down 23.5% compared to October last year.
October is usually a month when housing sales start picking up as the market heads into the summer selling season, but not this year, with October's sales down 2% compared to September.
On a seasonally adjusted basis, October sales were down 10.3% compared to September.
The situation was even tougher for sellers in Auckland, the country's largest housing market, where October's sales were down 30% on an annual basis, and 7.3% lower than September's, or down 8.7% when seasonally adjusted.
Perhaps unsurprisingly given the subdued market conditions, prices were also softer.
The REINZ's national median selling price was $763,000 in October, down 3.4% year-on-year.
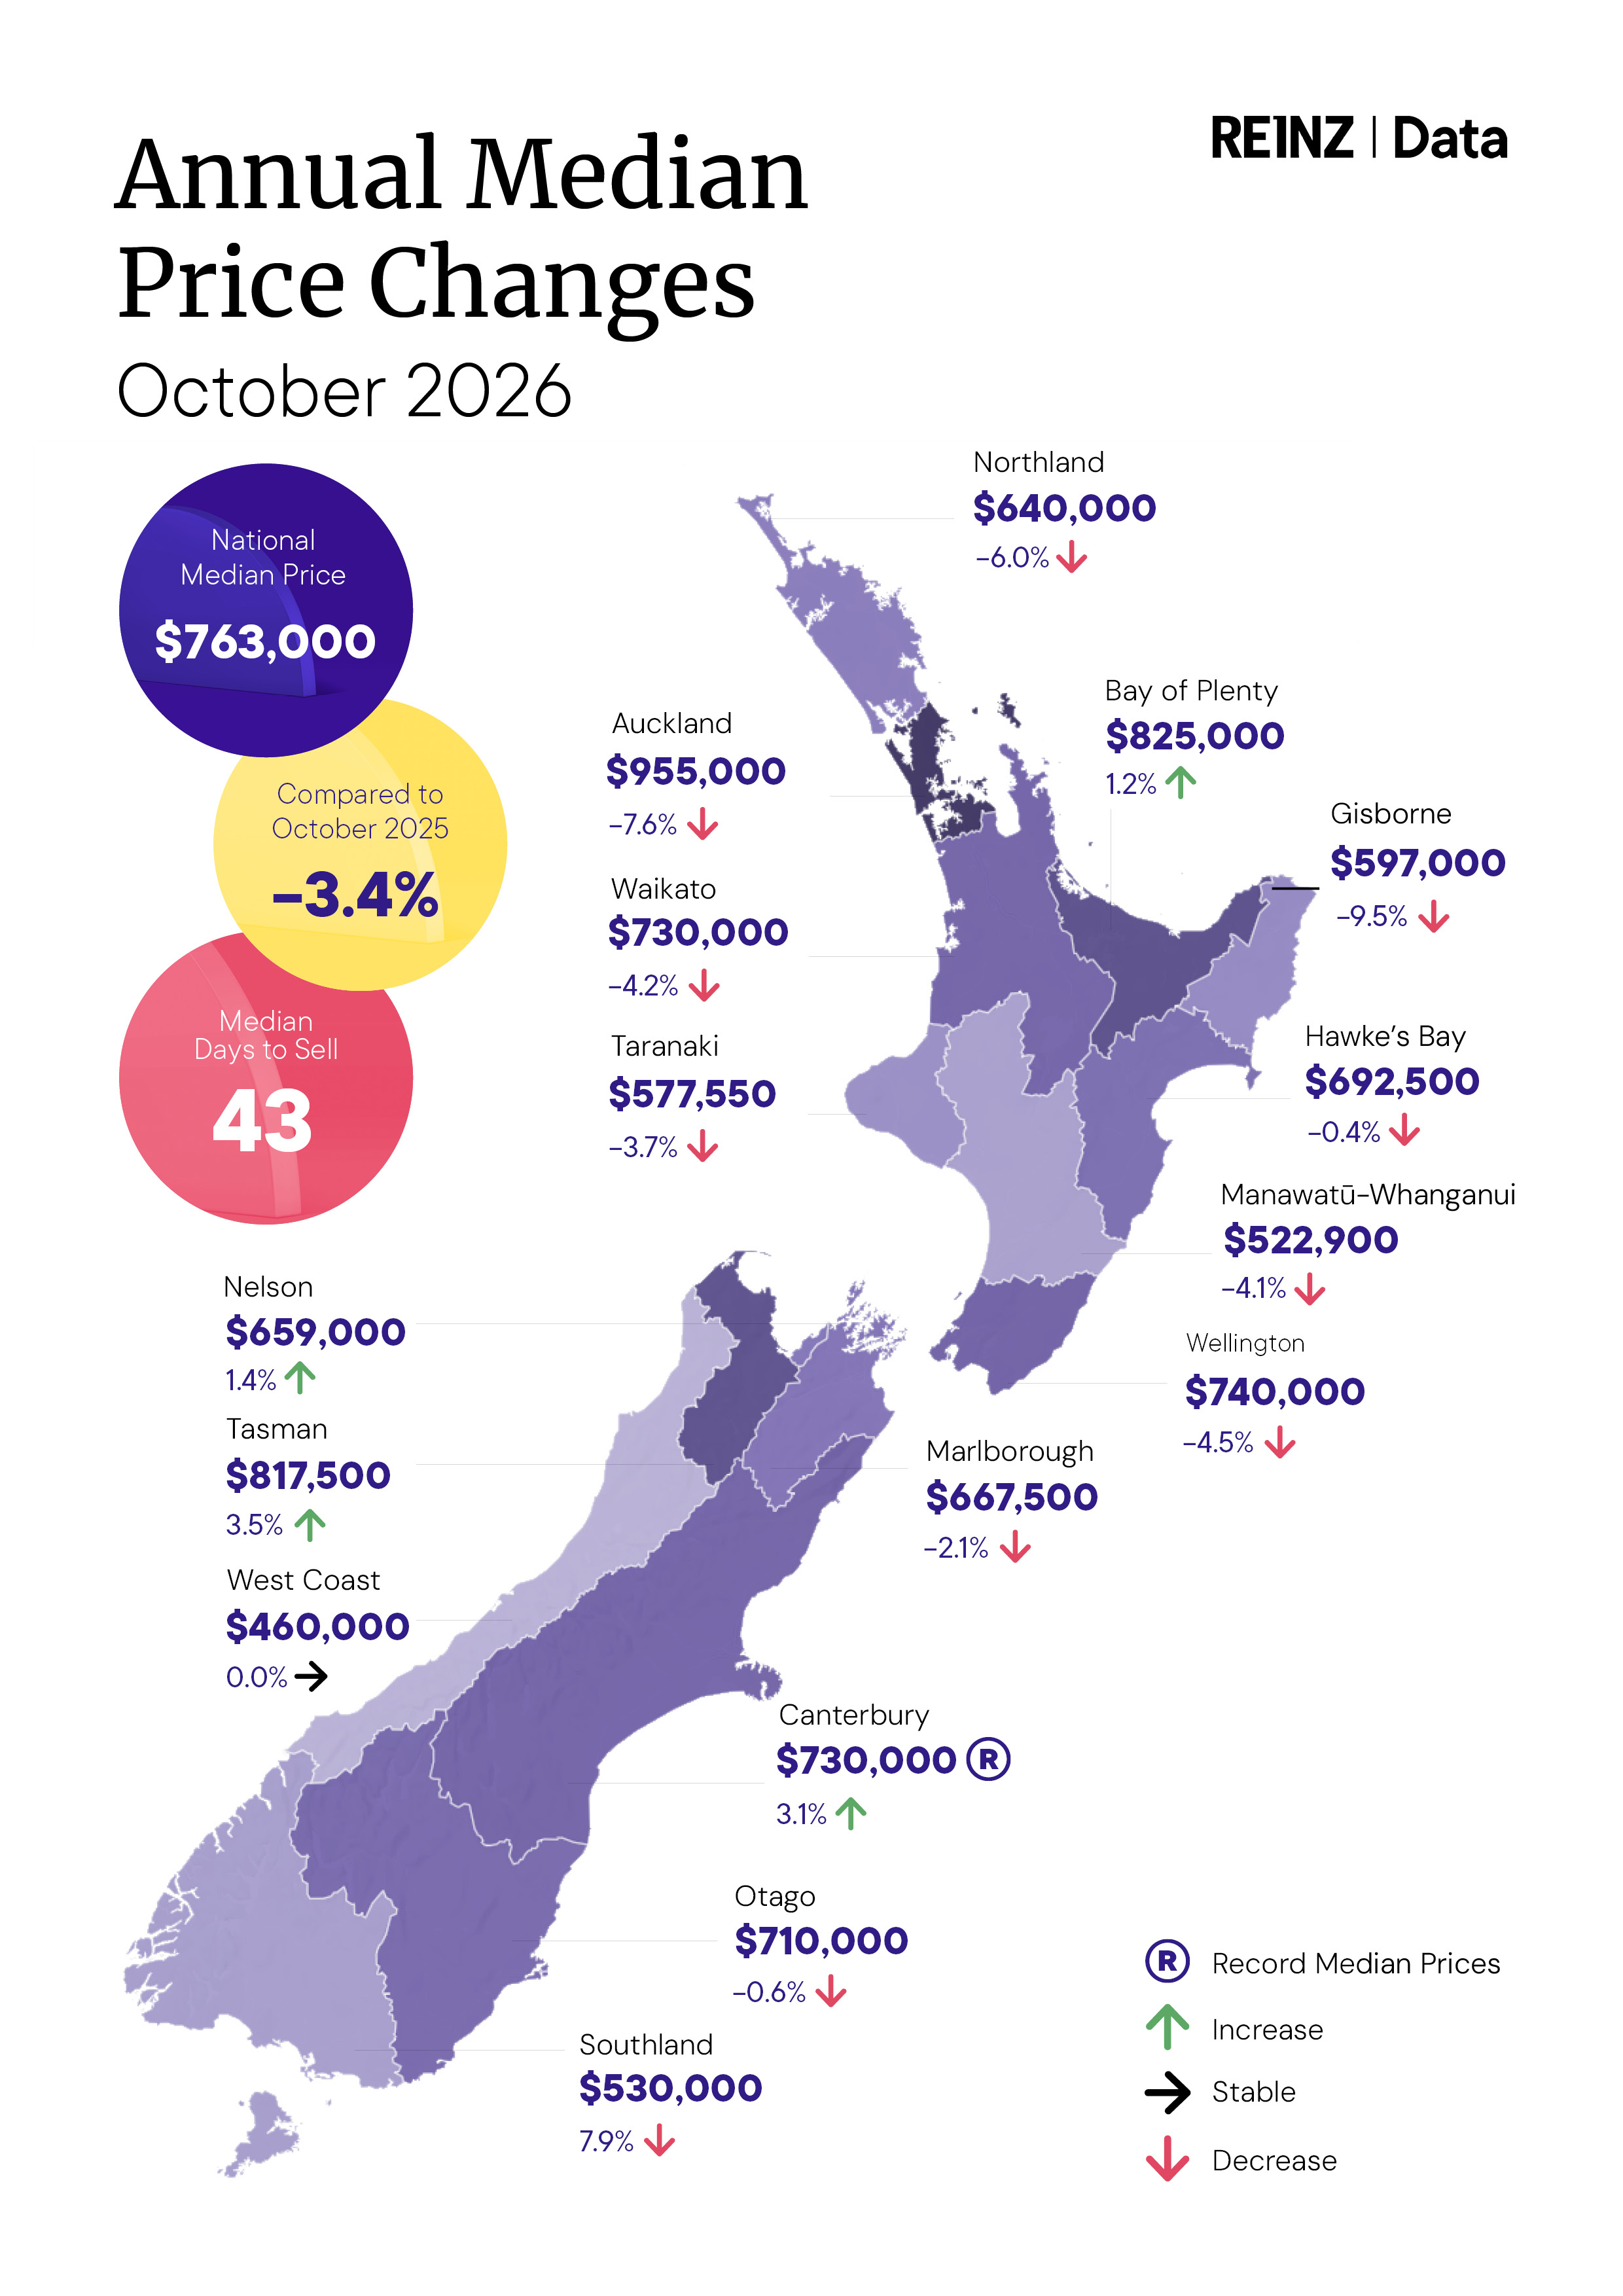
The biggest annual declines in median selling prices were in Gisborne which dropped 9.5%, Southland which was down 7.9%, Auckland down 7.6% and Northland down 6.0%.
Of the REINZ's 16 sales districts, only four posted median price gains compared to October last year. They were Canterbury up 3.1%, Tasman up 3.5%, Nelson up 1.4% and Bay of Plenty up 1.2%.
HPI ekes out gain
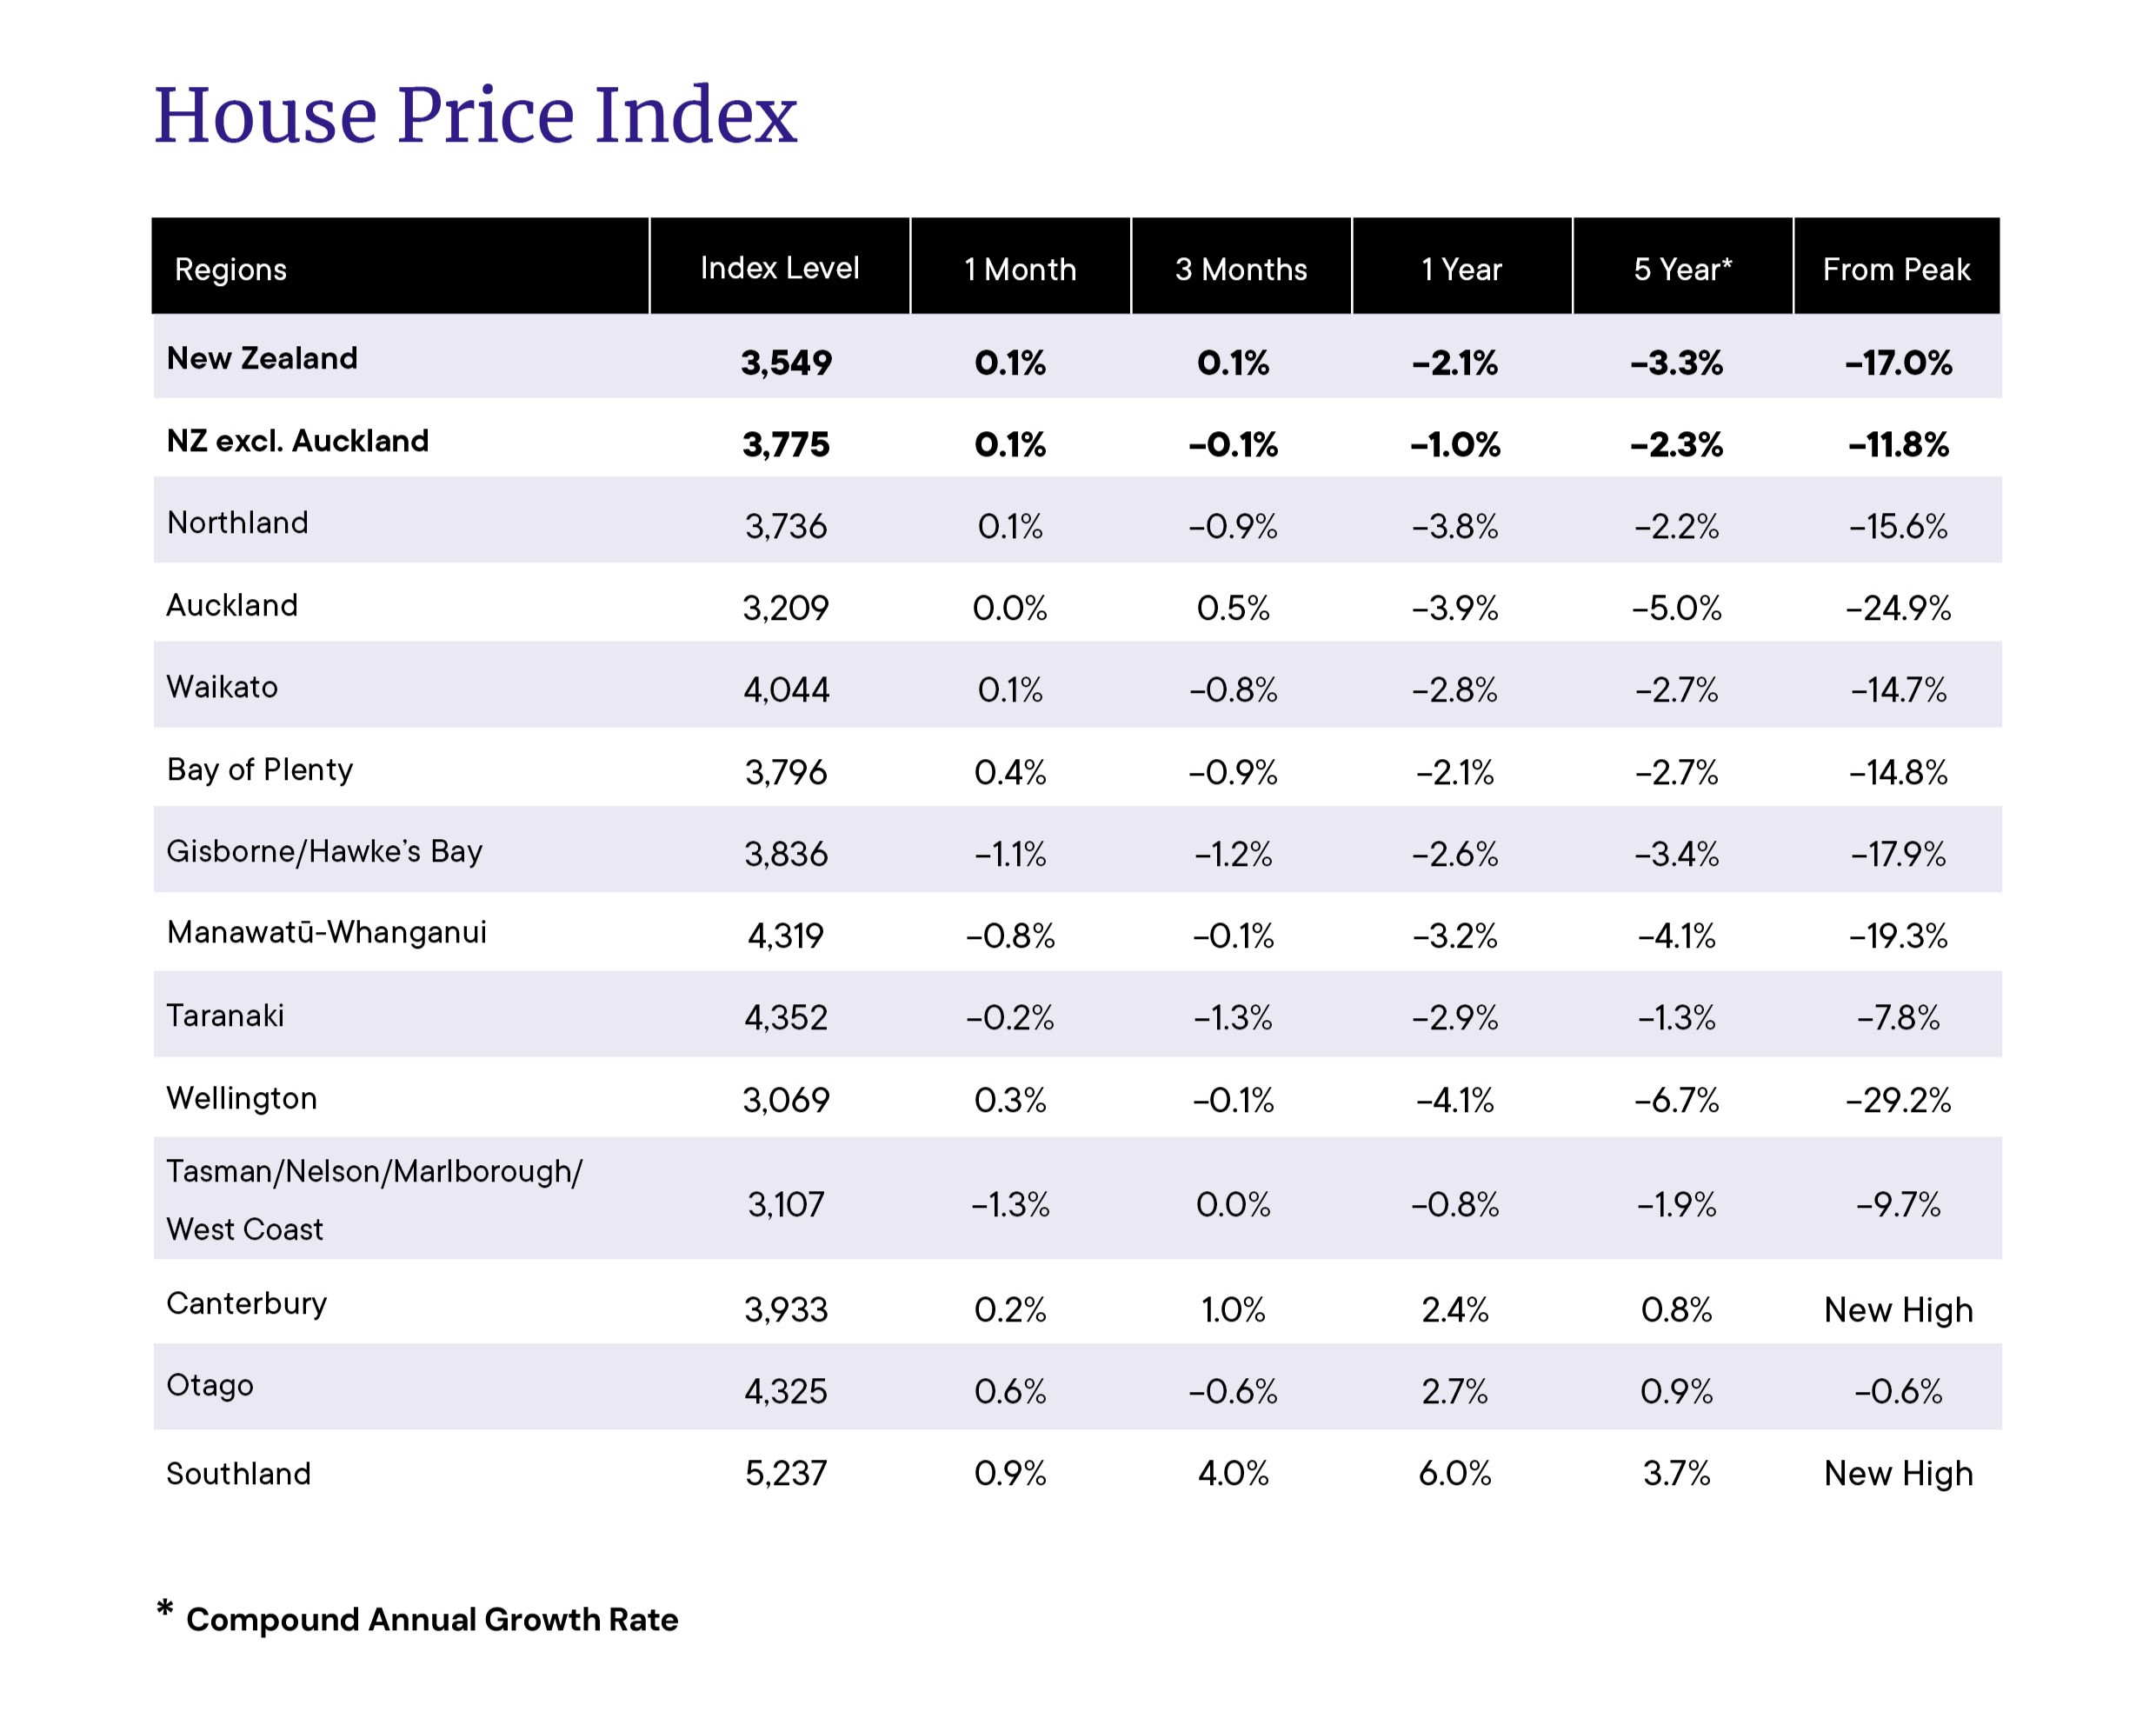
The REINZ's House Price Index (HPI) did slightly better, up 0.1% in October from September and down 2.1% compared to October last year.
"October's data shows a market that remains measured," REINZ Chief Executive Lizzy Ryley said.
"Greater choice is allowing buyers to assess their options carefully, while our members observed a measured approach among some vendors and buyers in the lead up to the general election."
"At the same time, well-priced properties continued to attract interest, with sales progressing where expectations aligned," Ryley said.
The chart below shows the annual median price movements in all 16 districts, and see the table below for the full HPI figures.

We welcome your comments below. If you are not already registered, please register to comment
Remember we welcome robust, respectful and insightful debate. We don't welcome abusive or defamatory comments and will de-register those repeatedly making such comments. Our current comment policy is here.