
The Opposition and some commentators point to what they call the ‘squeezed middle’ to back their arguments for middle-to-upper income tax cuts and when warning against Government or Reserve Bank moves that might cause a ‘housing crash’.
Actually, the ‘squeezed middle’ is quite plump and in no danger of some sort of forced rush-to-the-exits that would turn an expected 15% slide in house prices to anything more like a ‘crash’ of 30% to 50%. Middle-income households are in fine fettle, especially if they own their own homes, according to the latest statistics on income, mortgage costs, cash savings and household net worth.
National Leader Christopher Luxon has made much of what he calls the ‘squeezed middle’ in his cost-of-living attacks on the Government in recent months, arguing this group of 'hard-working average kiwis' was missing out on help from the Government in dealing with higher fuel, food and mortgage costs. These calls convinced the Government to pull a last minute ‘rabbit’ out of the hat in Budget 2022 of a one-off cash payment of $350 this winter for those who were earning less than $70,000 per year and were not receiving the winter energy payment (which cut out those on NZ Super and all households on the main benefit).
But are the ‘squeezed middle’ actually that squeezed?
It ‘sounds’ like they’re short of money because the headlines are a daily screaming drumbeat of higher prices for groceries, higher fuel prices, higher air fares and even (brace for it) tasty cheese costing nearly $20 per 1kg block. It seems ‘obvious’ to say those households earning around average incomes are going backwards and may even struggle to afford to buy food, fuel and pay for housing. Some commentators have even worried aloud about the risk of mass mortgagee sales caused by higher interest rates that causes a house price crash of 30% to 50%.
But is that actually true? Is there that much financial stress out there for homeowners that it could turn into a housing market rout, or force the Government needs to intervene with yet more ‘rabbits’ to feed the current accounts of the ‘squeezed middle’. It depends on what the Opposition means by ‘middle’ (it has never actually given a definition3), but it’s fair to assume it’s referring to those households on the average income, and who own a home. It’s perhaps not too surprising the ‘squeezed middle’ is around the median voter cohort of about 20% of voters that determine election results.
Poking around for the actual middle
Given we don’t have a clear definition from the Opposition, let’s look at the official range of measures. Firstly, the raw average gross income was $110,451 in year to June 2021, as reported by Stats NZ’s latest Household Income and Housing Cost statistics for the year to June 2021, up 4.5% from the previous year. The raw median gross household income was $89,127, up 5.4% from the previous year. But this is raw in that the very highest incomes4 will usually drag the average higher. It also doesn’t take into account the various taxes and ‘transfer payments’ (Working For Families, NZ Super, Accommodation Supplement and various benefits) that determine how much a household has to spend.
In the year ended June 2021, the average annual household disposable income (after tax and transfer payments) rose 4.5% from $84,648 in 2019/20 to $88,454. The median household disposable income rose 4.3% to $74,563.
But then there’s another measure, which is most broadly accepted among the experts. That’s ‘equivalised’ household disposable income, which removes the effect of different household sizes and compositions on estimates, and takes out the taxes and benefits. For example, if there had suddenly been an increase in the size of households with either workers or non-workers, then that would distort the ‘apples-for-apples’ measures of household incomes.
The median equivalised disposable household income before housing costs was $43,125 in the year to June 2021, up 5.1% from the previous year.
So the ‘loose’ measure would be household income of $110,451, while the most nuanced and ‘tight’ measure is $43,125.
That’s a useful starting point as a range, but it’s also out of date, given what we’ve seen with incomes and spending over the last year.
Plenty of cash and equity for the ‘squeezed middle’ of home owners
Stats NZ published national accounts data for the March quarter of this year this week, which showed what has happened to total household disposable income, savings and net worth over that period.
It shows total household disposable income in the year to the end of March rose 6% from the previous year to $217b, and was up 12.1% in the year just before Covid struck. Since Covid, households have collectively saved an extra $20b and increased their bank account cash and term deposit balances by $31.4b to $227b. They may well have kept some cash aside from selling some assets, including houses.
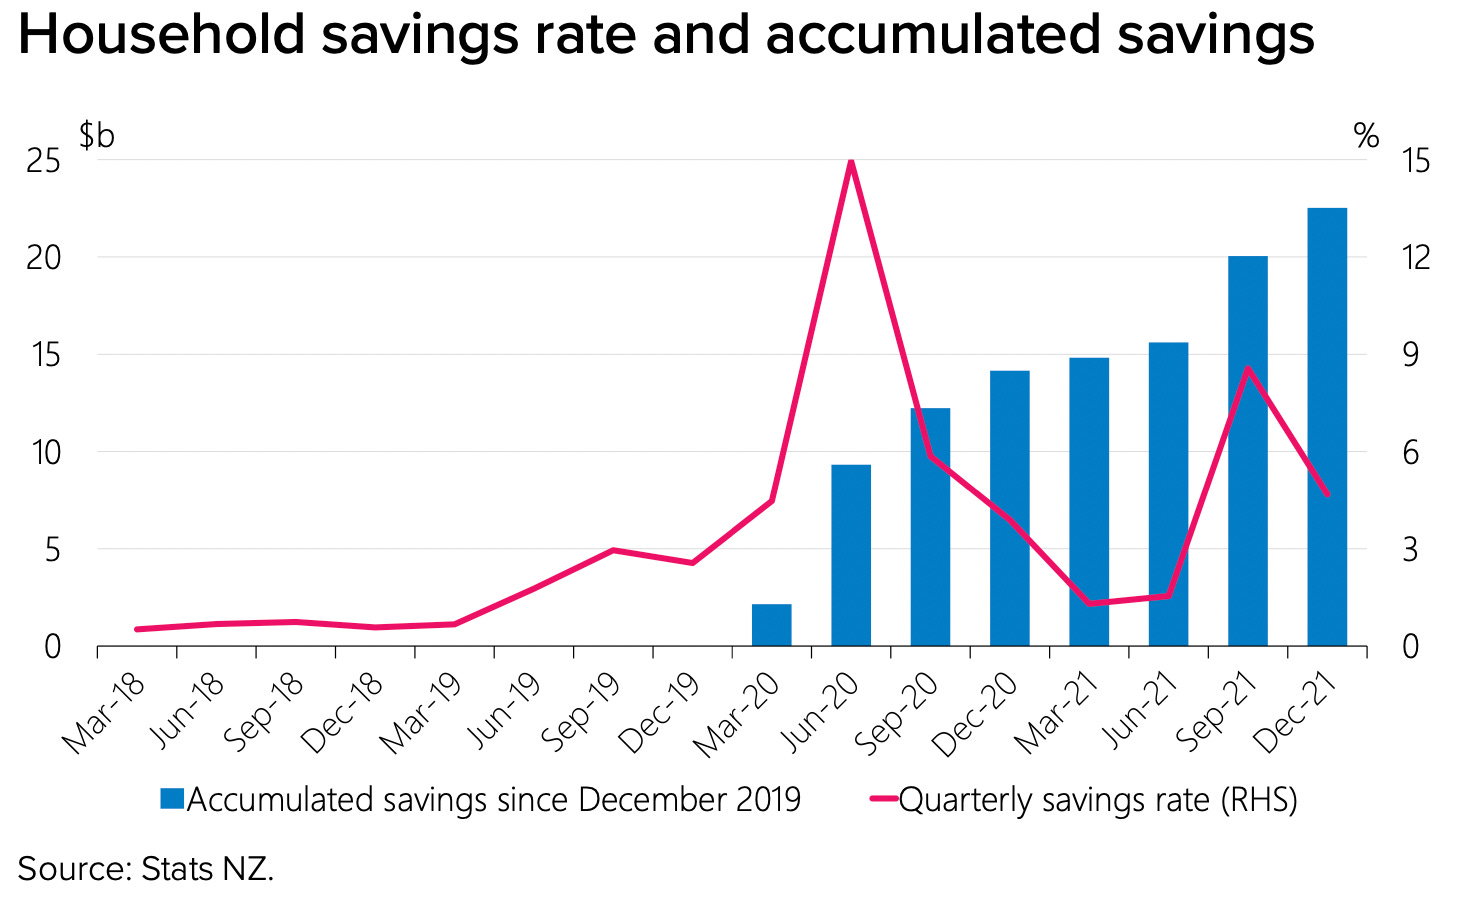
The net worth of households has risen by $621b or 34% since Covid to $2.421t at the end of the March quarter. That, of course, measures all households, but the vast majority of that is owned by home owners. Renters have not been able to save cash since Covid and they have not benefited from the rise in asset prices caused by US$9t of money printing by central banks globally since Covid.
So the bottom line here is that home-owning households have seen their incomes rise at least 12% since Covid, have socked away an extra $31.4b in cash, and have seen the net value of their assets, including property, shares, businesses and cash, rise by over $620b to $2.421t.
Higher mortgage rates not stressful at all to almost all home owners
Those households are also not stressed by a rise in mortgage and other debt of about $40b to $276b and a rise in effective (the average being paid) mortgage rates right now from around 2.75% to around 3.1%.
That’s because their total assets rose by $655b to $2.698t. Households have a collective loan to value ratio of 10.2% and the collective LVR on their homes is 20.4%. Their collective mortgage servicing costs are barely 6% of disposable income, well below the peak in September 2008 when mortgage rates were over 10%.
A lot of fixed mortgage borrowers have yet to roll to higher interest rates of 5.5% to 6.0% for new mortgages now, but even then, the collective cost is unlikely to touch double-digits.
Of course, those totals disguise a wide spread of situations, ranging from those with no mortgage debt to those first-home-buying couples who took out 80%-plus mortgages at debt to income multiples of over six to seven times income to buy houses late last year just before the peak.
But even they are unlikely to be in enough trouble that they couldn’t pay the mortgage or would be so far under water to make the bank nervous. That’s because the Reserve Bank has made it very difficult for first home buyers to gear up anywhere near 100% of the value of the home and the banks have used serviceability test ratios well above their actual mortgage rates. That means the bank wouldn’t have lent the money to the first home buyers unless they could pay the interest with a 6% mortgage rate.
Also, less than 10% of first home buyers were in the stretched situation of having a mortgage worth more than six times income and a loan of over 80% of the value of the home when they took out their mortgages.
The real worry for banks is if there is widespread and high unemployment and/or some sort of wage deflation. Neither is the case, with unemployment at 3.2% and any young home-buying couple more than likely to be on high and fast-growing incomes.
Even a 30% drop in house prices would not stress that many. The Reserve Bank estimated that just 1% of the banks’ mortgage books would be in trouble.
The banks are also much, much more capitalised than they were in 2008/09, which the Reserve Bank has estimated from its stress testing exercises mean they have buffers to handle even a house price slump of 40% in tandem with a 13% unemployment rate.
Only a few at the bleeding edge, but they have fast-rising incomes
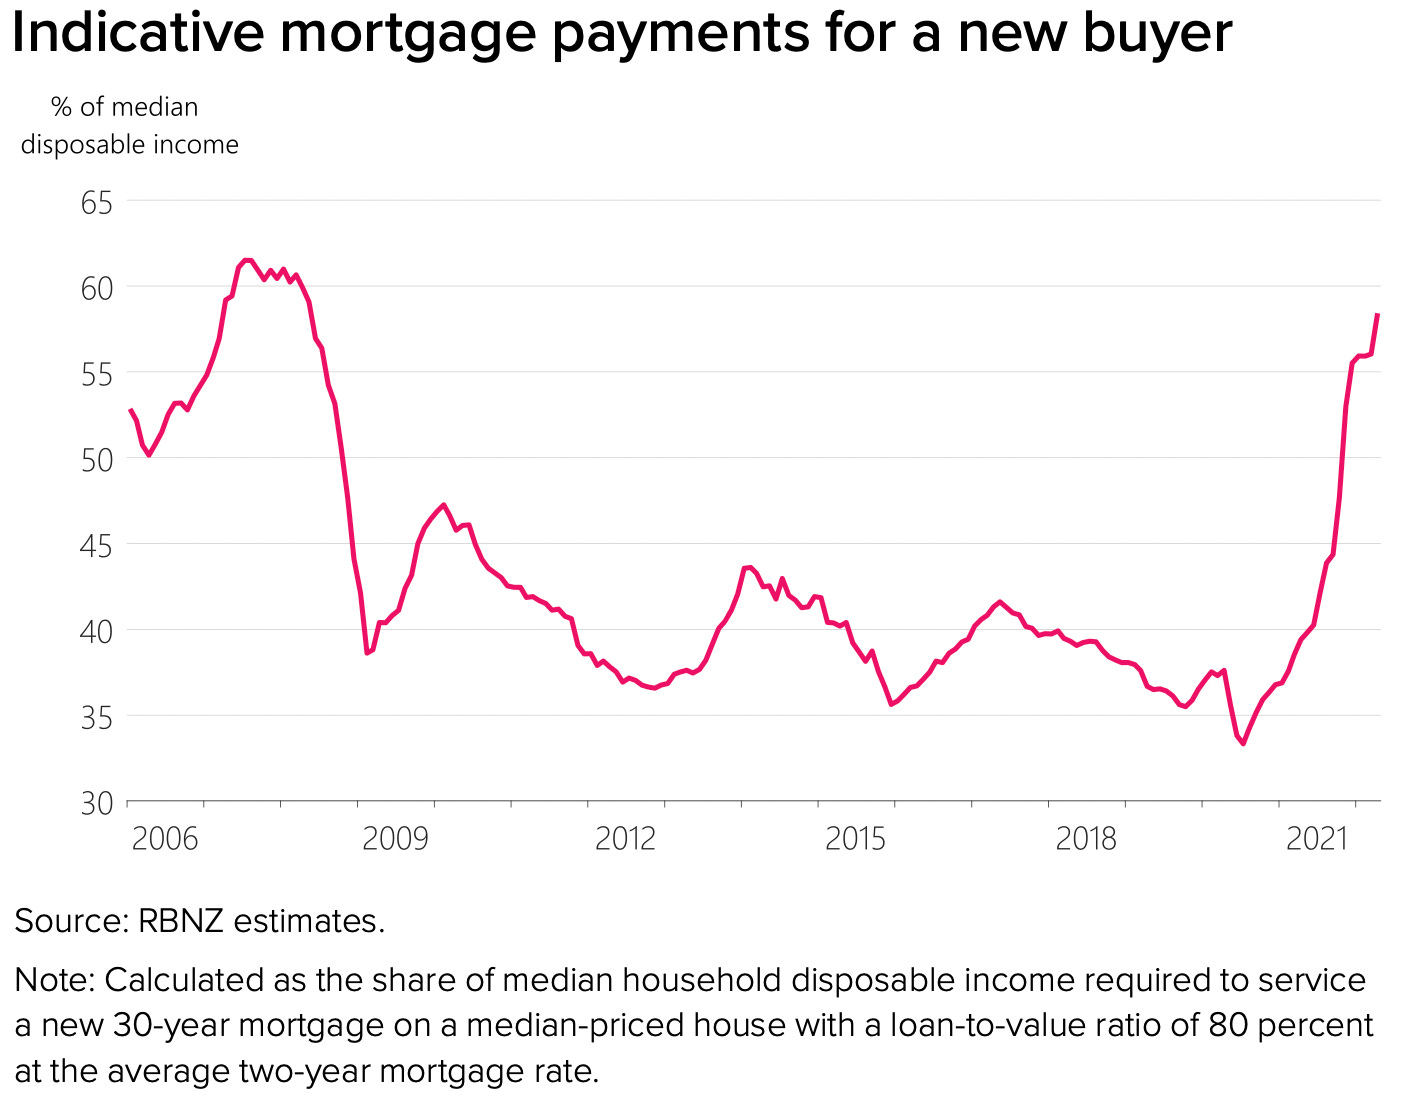
It is true that prospective first home buyers will struggle to pay for a home with the current prices and interest rates, even if they have a deposit, as the Reserve Bank has pointed out.
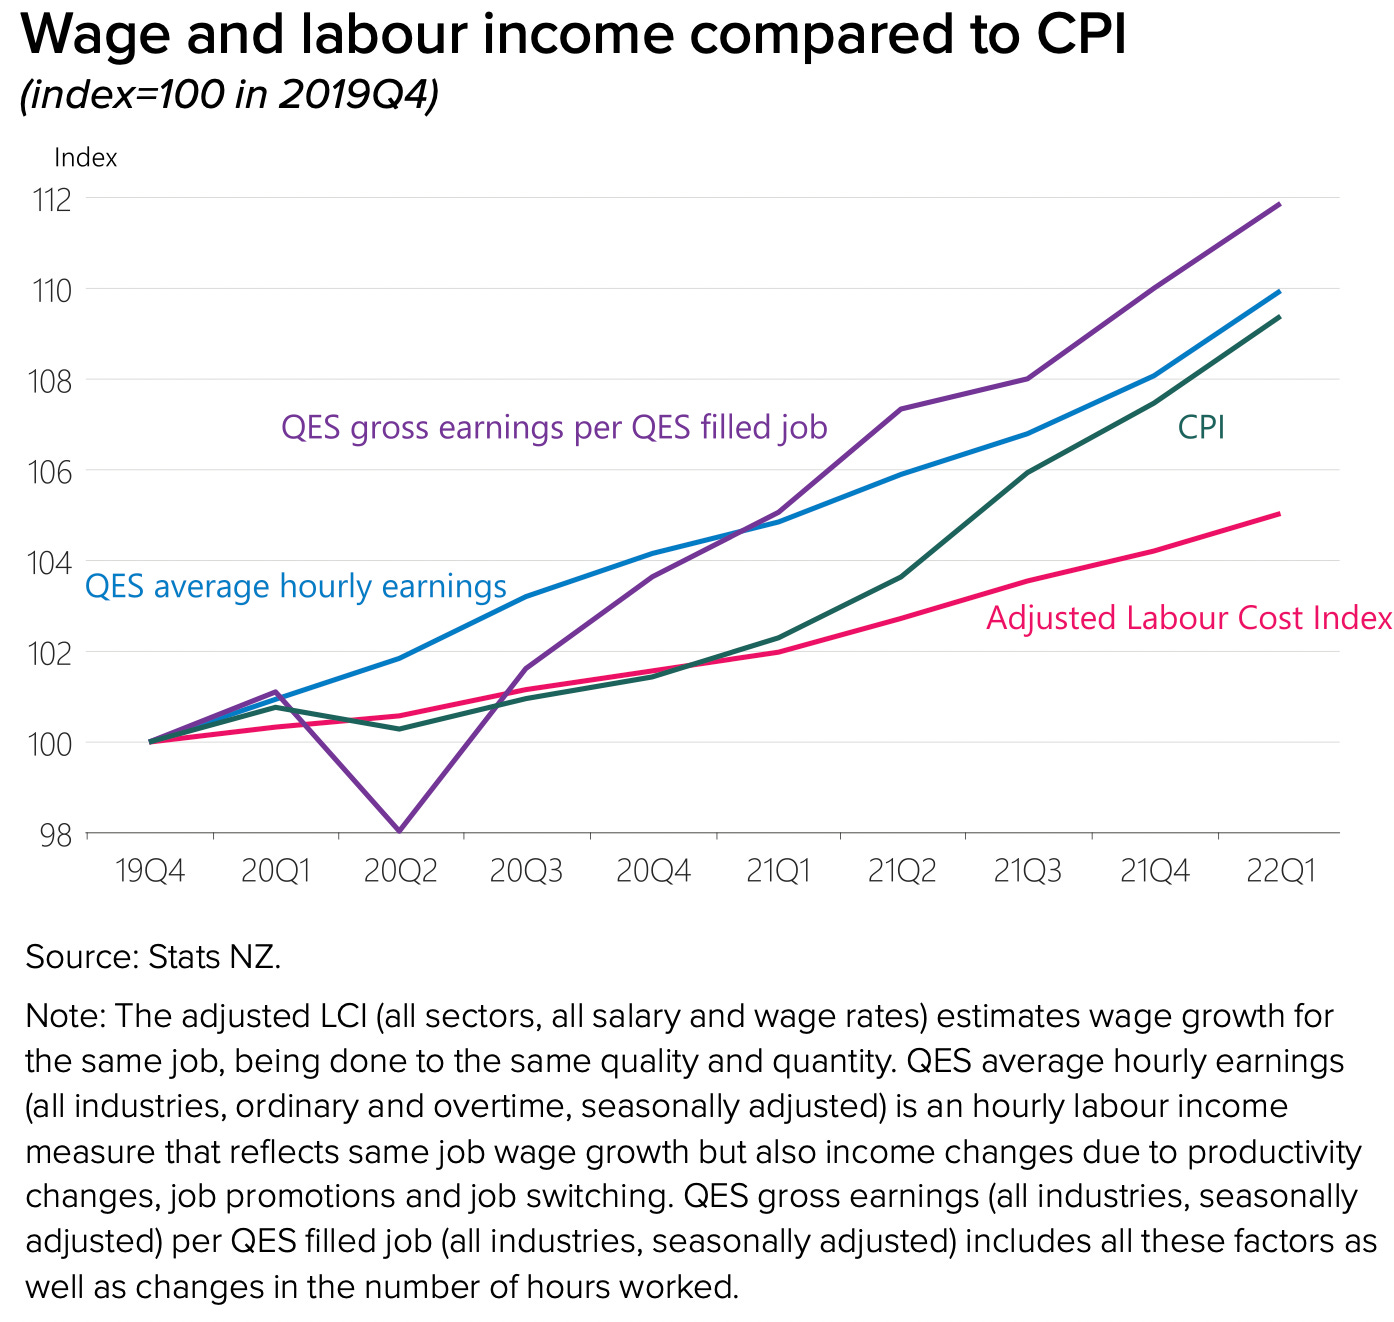
However, those people are also in the situation of having fast-rising incomes as they’re able to leverage bigger pay increases and work more hours.
As the Reserve Bank has also pointed out, households have actually increased their total incomes faster than prices have risen over the last two years. Even though inflation is higher than hourly wage increases, total income growth is stronger.
So what?
The key, as always, is whether the ‘squeezed middle’ household is a home owner or a renter. Home owners will overwhelmingly have significant cash buffers, much lower housing costs, strong income growth, even after inflation, and plenty of equity to help them sleep at night. They don’t need any help from National’s proposed tax threshold change that would deliver most of the dollars to higher income earners, or from the Government’s one-off living costs payment.
It’s the renters who are in trouble, but they’re unlikely to be the median votes the Opposition is targeting. They’re also, by definition, not the homeowners getting into so much trouble that they bail out of housing in such a way as to stress the housing market or banks.
They’re the ones who the most stressed at the moment, but they’re much more likely to be well below the ‘not-squeezed-at-all’ middle. They’re working poor and beneficiary households who weren’t actually eligible for Budget 2022’s rabbit and wouldn’t get hardly any of National’s tax cuts.
We welcome your comments below. If you are not already registered, please register to comment
Remember we welcome robust, respectful and insightful debate. We don't welcome abusive or defamatory comments and will de-register those repeatedly making such comments. Our current comment policy is here.