By Mark Gibbs*
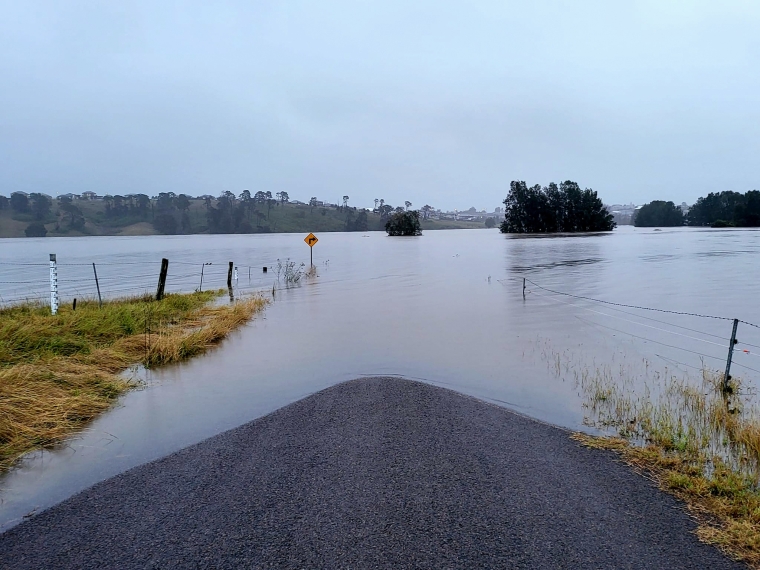
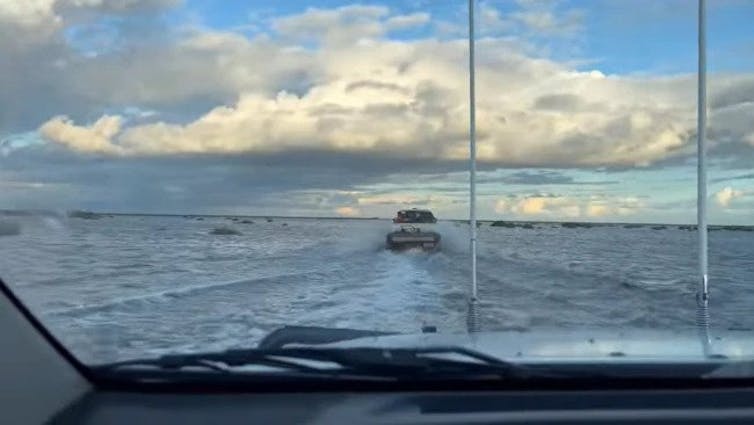
On Monday, residents of Eugowra in New South Wales had to flee for their lives. They had only minutes to get to higher ground – or their rooftops – to escape what’s been dubbed an “inland tsunami” of water. This week, many other towns across western NSW faced renewed floods. For many people affected, the real shock is how unexpected it was – and how fast the water came. Their houses and land had never flooded, as far as they knew. What had changed?
This is an important question with a number of answers. When we make these assessments, we’re drawing on two sources: local knowledge and, increasingly, what flood maps tell us.
While tremendously useful, local knowledge has limits. Human memory is fallible and written records do not stretch back far. Flood maps also have constraints. That’s because floods can differ greatly depending on where the rain falls, at what intensity, and over what period of time. We will also have to redraw flood maps more often, as climate change brings more extreme weather. As climate change progresses, the atmosphere can hold more water. This supercharges atmospheric rivers – huge torrents of water carried above our heads.
The result? You might think you’re safe if you drew on local knowledge and flood maps when choosing where to live. The reality is there always have been gaps in our knowledge, and homes built on floodplains once thought safe may not be any more.
This doesn’t mean we should ignore credible sources of information. But it does mean we have to remember every information source has some uncertainty.
This week:
— Mollie Gorman (@_MollieGorman) November 15, 2022
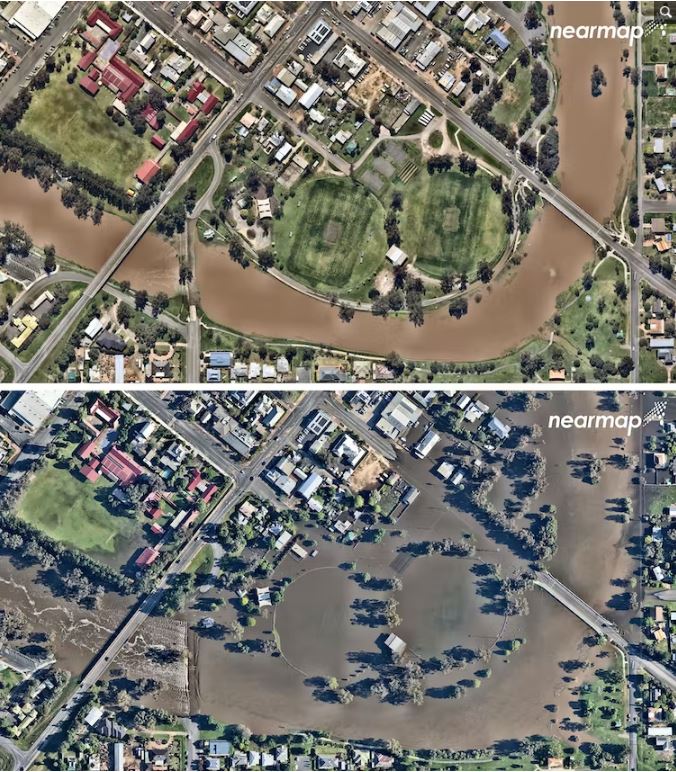
- All but two shops flooded in Molong
- Eugowra destroyed
- Bathurst biggest flood in 25 years
- Cowra first 14-metre flood in 70 years
- Houses flooded in normally dry Parkes
- Forbes set to break records
- Condobolin already has
This is catastrophic (1/2)
What are the limits of our knowledge?
Local knowledge held by long-term residents, historical records and hearsay are tremendously useful sources.
But these only reach back a short way in terms of the history of flooding. Indigenous knowledge of flooding reaches back far further, with oral stories of the flooding of Port Phillip Bay and many other locations passed down over many generations.
Australia’s floodplains have periodically flooded for millennia, renewing ecosystems.
What’s new are the towns and cities built along their banks. Early European settlers were often taken by surprise by the size of the floods, and a number of rescues were undertaken by Indigenous peoples.
In our time, communities are increasingly turning to flood maps produced by local and state governments to take stock of their vulnerability. This is broadly a good thing, as these maps can drill down to which streets are more vulnerable.
But they aren’t perfect – and they’re mostly only updated every few years. Some councils are still relying on outdated maps.
Flood maps are generated from computer flood models and simulate how floods develop and spread. To do this, you need to consider a range of variables. How much rain falls? When? Where? For how long? Is the ground sodden already, or dry as a bone? What has changed in the catchment since the last flood modelling study that may alter the overland flows of water?
Rain doesn’t fall evenly across catchment areas. Intense rain can carpet some areas and leave others all but untouched. In the devastating 2011 floods in South East Queensland, huge volumes of rain fell in the upper catchment of the Brisbane River, across foothills of the Great Dividing Range. Flash floods hit communities like Toowoomba and Grantham hard, while bayside Brisbane was experiencing light rain and sunshine – and had more time to prepare.
Many of this year’s floods, by contrast, have come from heavy rain falling on lower catchment areas, with repeated soaking priming the area for near-instant floods. That’s partly why cities like Forbes have been taken by surprise, with the worst floods in decades.
In short, every intense or extreme rainfall event is different – and that, in turn, means the resulting floods can differ dramatically.
What information should we rely on?
You can see the challenge for flood modellers. Which events do you model? You can’t model all of them, as it’s impractical to model all possible combinations of rainfall, location and so on. So you model the most likely combinations.
This is a major reason why major floods may not actually flood all of the houses in a designated flood zone in every flood, as it depends in part on where the rain is falling in the catchment.
In turn, this leads to confusion. People in affected communities may believe the flood models and warnings are wrong.
It’s been long understood this kind of information can be complicated and confusing for the people relying on it. Does the Annual Exceedance Probability mean the chance of a 1 in 100 year flood, or not? And if so, how can it flood twice in quick succession? There’s jargon galore.
When vital information is hard to understand, many people may give up and ignore the information. Others may make decisions based on their own interpretation or with social media.
It is hard to sift through complex information. We will need to continue to find ways to make clearer the likely risk for prospective home-owners as well as the danger from the more severe floods we can expect as the world warms.
For now, we need to stay as vigilant as possible on flood risk when choosing where to live. And we need to heed official warnings issued months ahead as seasonal outlooks as well as in the lead up to major rains. It hasn’t flooded here before? Unfortunately, it may be more accurate to say it hasn’t flooded here yet. ![]()
*Mark Gibbs, Adjunct Professor, Queensland University of Technology. This article is republished from The Conversation under a Creative Commons license. Read the original article.
58 Comments
The proposed Napier building, on recently flooded land, is so crazy..... are they doing it just because the iwi own the land?
Will the council have liability ? Will buyers be able to get insurance and at what excess / premium cost?
The clue should have been in the addresses of the properties:
https://gazette.govt.nz/notice/id/2021-ln432
...and...
https://gazette.govt.nz/notice/id/2021-go3779
Waterworth Ave was bought for $7,126,430 in August 2021, against an RV of $1M, or $831,293.54/Ha, unimproved.
Riverbend Road was bought for $6.5M in June 2021, against an RV of $1.61M, or $739.468.26/Ha, unimproved.
Yup.
Exactly. But not just there. We are repeating these mistakes all over NZ.
We seem to be making our where to build decisions in the context of what we think the sea level will be by the turn of the century. That in it's self is a disturbingly short sighted view. Would you want to build a house that will be at risk of being uninsurable in 78 years. To make matters worse projected sea rises by the end of the century has been a procession of ever increasing heights. Because we are starting with bare land it makes no difference whether we choose high or low land. I would have thought that the sensible thing to do would be to shift all house building to levels well above any possible sea level. The maximum possible rise is something like 60 to 80 meters.
I read somewhere yesterday that there are now whole post codes in this area of Australia that the insurance companies now refuse to insure. So beware you can easily and very suddenly loose all the value of your home and be left with the mortgage.
Indeed.
And as for the residual Land Value of any uninsurable dwelling. What Land Value?! Isn't that effectively what the insurers now won't insure, the risk associated with the Land?
It would take many many thousands of years for sea levels to rise substantially.
Houses are built to last 50-100 years.
As usual, BL is full of it.
Reminds me of someone who lost a court-case agin the Government.
At core, his posit isn't even logical.
But then, neither was that case.....
I'm sure that Mr Grimworld has a legion of his handpicked "scientists" to tell us that 60m-80m of sea level rise is going to happen by any day now, because iTs ThE PhYSiCs.
Those with an actual clue know that it would take millenia upon millenia for Greenland and the Antarctic ice caps to melt away even with the most dire climate projections.
Because it's the actual physics and the Grimworld nihilist hysteria doesn't stand up to scrutiny, as usual.
Brock,
Otherwise known as Canute. Just where did you acquire this piece of 'knowledge'? How do you define substantially?
Perhaps if pushed further, you would deny that sea levels are rising at all, that wouldn't surprise me. I don't think you are unintelligent, so please do some research into the basic science behind anthropogenic climate change. You will find that a) it's long established and b) it's not hard to grasp.
When do you leave for Australia?
Hi Linklator01,
I define substantially as the drivel that MensaCarlos was spouting about 60-80 meters of sea level rise.
We are forecast to get about 80cm by 2100 if we do little to curb emissions. You can lookup yourself how long it would take for Greenland and Antarctica to actually melt and post your findings here.
I know that sometimes my cold rational facts can be grating to those who who prefer incoherent autistic screeching.
I am physically in Australia at the moment. Thanks for asking! How's your health doing?
"The maximum possible rise is something like 60 to 80 meters."
Source ?
https://en.m.wikipedia.org/wiki/Sea_level_rise
"Over the next 2000 years, the sea level is predicted to rise by 2–3 m (7–10 ft) if global warming is limited to 1.5 °C, by 2–6 m (7–20 ft) if it peaks at 2 °C and by 19–22 metres (62–72 ft) if it peaks at 5 °C.[5]: 21"
How about the US government?
https://www.usgs.gov/faqs/how-would-sea-level-change-if-all-glaciers-me…
As I said the navel gazing to date has been a a procession of over optimistic guesses. It cost very little to assume the worst case . 1 hectare of land at 100 meters altitude costs much the same as a hectare at 6 meters, and that cost is insignificant when compared to the development of the required infrastructure. All the money invested to the low lying land will be lost if the sea takes it.
Here is a plot of the historical temperature rises
https://www.climate.gov/news-features/understanding-climate/climate-cha…
Here is a plot of the annual CO2 emissions
https://www.iea.org/data-and-statistics/charts/global-energy-related-co…
We are already at about 1C rise. Ignoring the drop in emissions over the pandemic period the CO2 emissions are merrily increasing exponentially. As the latest COP confirms, there nothing that gives any confidence that we are any where near starting to reduce the increase in CO2 emissions, let alone reduce them. 1.5 C rise limit is a total fantasy. We will be lucky to limit it to 5C.
Time to panic?
Panic doesn't achieve anything.
I was looking at those two graphs and thinking about how they are connected. The analogy of driving a huge machine came to mind. Our CO2 emissions are like the accelerator. The machine is enormous with massive inertia so there is a very very long lag in it's response. We are exponentially pushing our foot down further on the accelerator. If we were to stop our increase in emissions, then the inertia and lag will mean that the "speed" (global temperature) will keep rising for a very long time. Heaven knows where it end up by the time we reduce our emissions and the climate machine catches up with the lag. A lot higher than we are hoping I suspect, looking at those two graphs and our failure to act meaningfully.
So, what you & the US government are assuming is that the world is completely ice free.
Which last happened around 35 Million years ago (Eocene period). Average Temperatures ~15 degrees C warmer.
"Academic" = no practical use.
So you are prepared to gamble that the massive sustained human impact on our climate is far less than what ever was at play during the eocene period which was caused by a large release of CO2 and geologically store methane. Some of the positive feedback mechanisims that we have triggered could do exactly the same thing.
Biblical world ending floods have been written about since, well, the time of the bible if not before. Geologically speaking, mammalian and plant life thrived and evolved on Earth when the dinosaurs went and CO2 levels were around 1000ppm. If world ending calamity is the fear here we probably should be paying more attention to the new generation of Russian nuclear weapons. Forget about the end of the world in twenty years, it can be done in twenty minutes now.
No - don't forget the long game; we have to remember both, simultaneously.
:)
The physics of ice mean that ice melt will lag temperature rise, quite substantially. We do not need to assume even 3m sea level rise over the next 200 years, which is probably enough to cover the lifetime of an exceptionally well-built house.
Flood plains are a different matter.
The Napier subdivisions are unbelievable and one wonders how they are possible, very low lying with pumped stormwater and highly likely at risk of liquefaction. They are also encroaching on horticultural land. Napier should build up, inland from the airport and inland from Taradale.
Hastings too, should not rezone any more horticultural land, industrial or residential. There is massive pressure from developers to do so. Something like a satellite city at Peka Peka or more rural sections should be considered, but no, rezoning that plains land is far to tempting.
Flooding and floods in nsw was not uncommon in the 60s 70s and since. Ozzi farmers have a saying, there's more money in mud than in dust. Meaning that it is better to have too much water than not enough
Here comes the spin.
I habituated Canowindra, Cowra; drifted down the Lachlan picking blackberries, know the area well. But it has never been this high.
The intensity is due to global heating - the storm events simply amass more energy, so too the O/Ds (cu-nims). So too, do the fires. Australia is in trouble, from both ends.
The article - notably - avoids that point.
As will certain commentators with vested interests.
I habituated Canowindra, Cowra; drifted down the Lachlan picking blackberries, know the area well. But it has never been this high.
"Never" apparently being during the few decades of your lifetime that you've been aware of the area. As the article suggests, this tiny timeframe is not much of a measure.
not like we are short of hills.
Sadly, I suspect that this weather pattern is here to stay. The article is very narrowly focused on the local effects. Fair enough, it describes the very real effects on the locals. We also need to put this situation in the context of the causes and mechanisms at play. For example one of the factors in the 3 years of La Nina, which is one of the factors here, starts with effects of global warming in the Arctic. Increased ice melt in the Arctic is lowering the salinity and density of the sea water. The less dense sea water is less able to sink as it cools and so resists the circulation of the Gulf Stream. This means that less heat is transferred away from the already overheating central Americas. This flips the weather into the La Nina mode. Accordingly it will not be surprising if this weather pattern predominates in the future.
But hey there may be some positives after people have relocated their homes. Rice growing in inland parts of Australia. Far greater areas of arable land supported by large reservoirs.
Throw in the after effectes of the Tongan Volcano.
https://www.youtube.com/watch?v=EZtRKbTdQVw&t=650s&ab_channel=OzGeograp…
Thank god for BadDragon. We had an exceptionally large volcano go off nearby. Lots of water and stuff got blasted into that wee bit of nothing much that encapsulates earth. Unusual things were bound to happen. Take a chill pill everyone.
The super volcano near Tonga sent a bit of water into the stratosphere.
Correct. This lowered temps over Antarctica, which pushed the usual circumpolar weather systems quite far more north than usual.
Uninhabitable bro, doesn't have to get like Mars before you cannot actually live there. The effects from Climate change are only going to get worse.
I'm having an incredibly pleasant day in Sydney today. I hope you're enjoying the rain.
Brisbane is delightful today too.
Brisbane is currently sunny 26C, perfect weather!
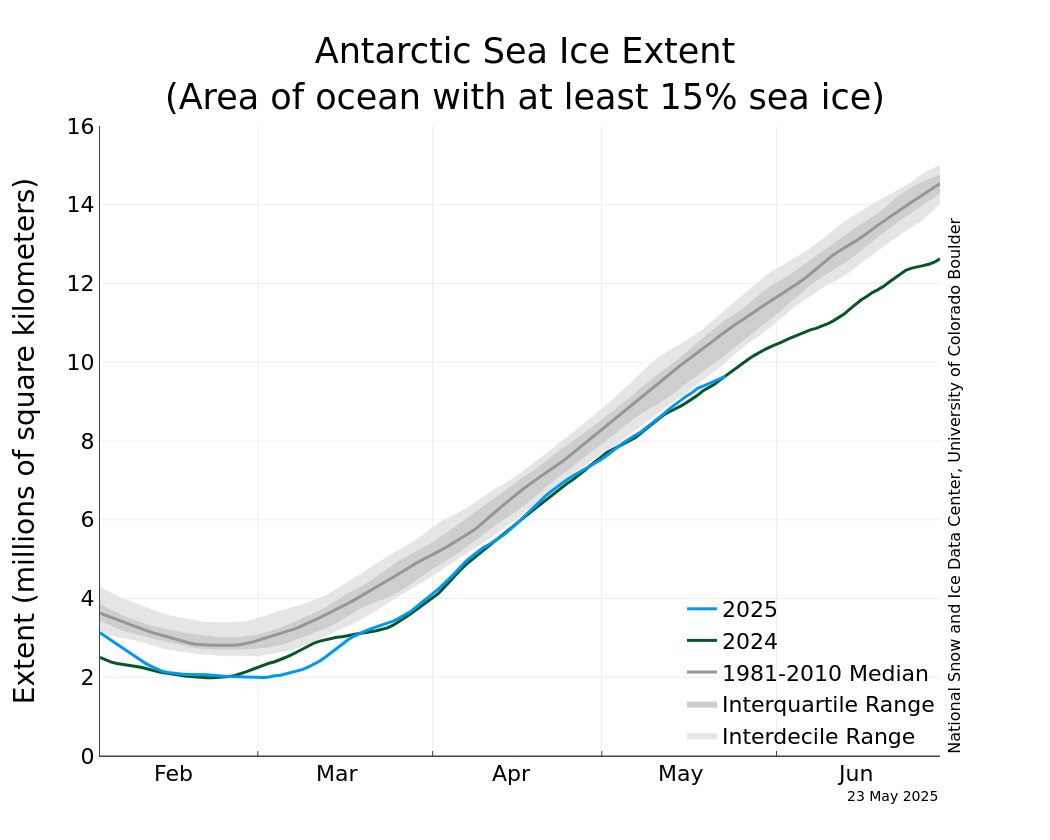
? Colder antarctica = less ice?
https://nsidc.org/data/seaice_index/images/daily_images/S_iqr_timeseries.png
Mainly anecdotal but I have noticed a firm trend in Auckland. I take an interest in weather systems as I have done a bit of offshore sailing and like to watch the forecast develop into events for educational purposes. I may need to avoid a storm in the future.
We purchased a property in 2011 that was very exposed to SW winds. In winter, curtains on the SW end of the house would sway in Winter. We had great Ruapehu ski seasons. The cold SW systems would move up the entire country and impact Auckland.
Later we noticed that the SW systems seemed to lose all their intensity around Ruapehu and Auckland got moderate weather instead. Then finally Auckland only got NE storms, in fact the power copmanies now note NE cause the most lines down events. Aucklands weather is turning subtropical, potentially meaning our large eve roofs will become vulnerable in the case of a sub tropicle cyclone one day.
Now Ruapehu is seeing the sky rivers of warm rain wash away the snow.
Yes these trends may reverse, but they may also increase in intensity, if forced to bet I imagine the latter will occur. The trend is your friend, or not. An event like the one that hit Nelson, or indeed a repeat of Cyclone Bola in Hawkes Bay (March 1988) would almost mean that these flood prone suburbs are underwater again.
This is not an anti-Labour rant, the Waipukurau Hospital site is never going to flood. a great place to build 900 homes... and a great buy in 2015 for 151k... plus the assumed liability to remove the buildings.
The Napier plan is shear madness.
As an Aucklander, the decline in our winter intensities has been stark over the last decade. I see the CNI now going through the same pattern - one or two large cold weather events a year but with a pattern of NE highs and Tasman warmth sending cooler weather across the face of the South Island. Baseline winter is almost completely different to what it was in the 2000s.
If what happened in Auckland is a taste of things to come, the CNI will have the worst of both worlds: moderated winters with less consistent snow and fewer cold weather events (but greater in intensity) AND the heat island effect magnified from being so far inland in every direction. Summers in Taupo were at the limits of bearable in the early 20X0s when I was last there in peak heat, I'd imagine it's borderline dangerous for elderly and children without the right shade or hydration.
You do need waders to fish the Tongariro in summer, but may wear them to fend off sandflies etc....
My inbox is full (4 this week) of changed to negotiation - Turangi Property , with price ranges and a comment that they would take lower offers to the vendors..... maybe a summer home?
"We identify several extreme daily rainfall events in the pre-1900 period in Sydney and Melbourne that warrant further examination as they appear to be more extreme than anything in the modern record."
https://www.sciencedirect.com/science/article/pii/S221209471930009X#fig1
People who build/purchase houses on flood plains shouldn't really be surprised by...flooding.
- People who build/purchase houses near a volcano shouldn't really be surprised by...eruptions.
- People who build/purchase houses near fault lines shouldn't really be surprised by...earthquakes.
- People who build/purchase houses near the ocean shouldn't really be surprised by...Storm surges, tidal waves, and king tides.
- People who build/purchase houses on hills shouldn't really be surprised by...erosion and landslides.
- People who build/purchase houses in the desert shouldn't really be surprised by...droughts.
- People who build/purchase houses in high wind areas shouldn't really be surprised by...high winds.
Yet all we see on the news is "I have never seen anything like this in my time here". Most people cannot comprehend abstract concepts. Until it happens to them, it is just another story.
There's an Australian film called the Last Wave which features the discovery of ancient cave drawings detailing the end of days via a large wave. But first it starts raining and doesn't stop.
Some guy called Noah wrote of this in long times....
The new flood maps for my area came in today. They show the newest subdivision to be under half a metre of water in a 1:100-year event. The houses aren't built yet. There should be some pretty hefty constraints on the building consents if you ask me.
But what council is going to restrict building in areas which are currently zoned residential. Moral hazard nightmare awaits
it boils down to the fact that there are too many people.
We live in the best places, first. Sequentially, that means every next place, is worse.
And we're now forcing the issue in dregsville.
The only cheerleaders being those who stand to profit (but who always live somewhere else).
Some of the smartest people in the world are asking - WTF is it with population growth.... we all know who will starve it will not be NZers....
But, but NZ is underpopulated!
NZ is overpopulated. With 3 million people our low income family had a bach 10 meters from the sand.
PDK is right. First we occupy the best places. Then as population increases we occupy the second best places. Then.............
Hmm, we regularly congratulate ourselves on having a property that will never flood. If it did the North Island would mostly be under water. Unfortunately when you dig around here one finds the charcoaled remains of trees smashed over under pumice. It doesnt matter where you camp, theres always something that could give you a very very bad day.
'In turn, this leads to confusion. People in affected communities may believe the flood models and warnings are wrong.'
Essentially because they are...however they are the best we have managed to date...insufficient, but better than nothing.
Box on models:
All models are wrong. But some are useful....
It's caused by La Nina weather patterns. Nobody wants to talk about it because we've had three La Ninas in a row and La Nina is a colder weather pattern event. That runs counter to the CO2 induced climate change fantasy.
And when the la nina phase of the southern oscillation is done we will have el nino, and people with short memories ill be complaining about 'droughts' ... like they did in 1990 (Auckland water shortage during the Commonwealth Games), and in 2009 (truckloads of stock feed coming from the south for Waikato and Northland), and when ever the last Auckland water crisis occurred (3 or 4 years ago? ... but maybe that was largely due to expanding population and lack of infrastructure expansion to cope?)
Three la nina phases now, but still not as wet in this area as the last strong-ish la nina in 2011(?) when a lot of Northland was under water and Kaeo was evacuated. But Kaeo gets flooded often, because it was built on a flood plane. Hello! to the proposed development in Napier. Greed and human stupidity are an interesting mix.
The last 3 summers here have been extremely dry. It is the south of Australia that is unusually wet and cold.
As I said above....colder but less sea ice in Antarctica?
https://nsidc.org/data/seaice_index/images/daily_images/S_iqr_timeseries.png
It's a bit more complicated than el nino = hot, la nina = cold. It depends on location and time of year.
https://niwa.co.nz/climate/information-and-resources/elnino
At a global level el nino years do tend to be warmer, but even with la nina for 3 years the trend in temp is still up...the next time we get a strong el nino records are gonna tumble...
https://www.youtube.com/watch?v=_k7Hep49Yzw
La Nina explained in 60 seconds.
Doesnt really effect australia except for the East coast. But of course that is where the most population live.
That runs counter to the CO2 induced climate change fantasy.
https://www.realclimate.org/index.php/archives/2007/08/the-co2-problem-in-6-easy-steps/
Yeah, nah. "Step 5: Climate sensitivity is around 3ºC for a doubling of CO2"
Published measures of climate sensitivity:
R Graphics Output (wordpress.com)
Yeah nah. And here's a proper link
https://agupubs.onlinelibrary.wiley.com/doi/10.1029/2019RG000678
The 66% range is 2.6–3.9 K for our Baseline calculation and remains within 2.3–4.5 K under the robustness tests; corresponding 5–95% ranges are 2.3–4.7 K, bounded by 2.0–5.7 K (although such high-confidence ranges should be regarded more cautiously
Did you check out any of the papers on the link that didn't match your world view or yeah, nah? Could you not lower yourself to search up published papers from an un-"proper" link?
"Objectively Combining Climate Sensitivity Evidence
...The resulting estimates of long-term climate sensitivity are much lower and better constrained (median 2.16 °C, 17–83% range 1.75–2.7 °C, 5–95% range 1.55–3.2 °C) than in Sherwood et al. and in AR6 (central value 3 °C, very likely range 2.0–5.0 °C). This sensitivity to the assumptions employed implies that climate sensitivity remains difficult to ascertain, and that values between 1.5 °C and 2 °C are quite plausible."
https://link.springer.com/article/10.1007/s00382-022-06468-x
"Advanced Testing of Low, Medium, and High ECS CMIP6 GCM Simulations Versus ERA5-T2m
...We found that all models with ECS > 3.0°C overestimate the observed global surface warming and that spatial t-statistics rejects the data-model agreement over 60% (using low-ECS GCMs) to 81% (using high-ECS GCMs) of the Earth's surface. Thus, the high and medium-ECS GCMs are unfit for prediction purposes. The low-ECS GCMs are not fully satisfactory yet, but they are also found unalarming because by 2050 they predict a moderate warming (ΔTpreindustrial→2050 ≲ 2°C)."
Advanced Testing of Low, Medium, and High ECS CMIP6 GCM Simulations Versus ERA5‐T2m (wiley.com)
We welcome your comments below. If you are not already registered, please register to comment
Remember we welcome robust, respectful and insightful debate. We don't welcome abusive or defamatory comments and will de-register those repeatedly making such comments. Our current comment policy is here.