

This is a Special Topic in the December issue of Treasury's Monthly Economic Indicator report.
The Treasury regularly carries out an assessment of the accuracy of our biannual forecasts: the Budget Economic and Fiscal Update (BEFU) and the Half Year Economic and Fiscal Update (HYEFU). These forecasts underpin the Treasury’s fiscal advice and the Government’s fiscal outlook, as well as outlining the economic context in which Ministers make decisions. Therefore, it is desirable that these forecasts are as accurate as possible.
Broadly speaking, a “good” forecast consists of two features. First, the forecast should be unbiased: the forecasts do not tend to systematically over or underpredict economic outturns. A set of forecasts is said to be unbiased when the average of forecast errors, defined as the differences between the actual outturns and the forecast values, is zero.
The second criterion is that the deviation of the forecast errors from their mean is small. This way, one can be confident that even if a forecast error arises, it would be within a plausible range. To measure this deviation of forecast errors, we use the root mean square errors (RMSE).
We apply these two criteria to three variables of interest, namely, the average annual percentage change in real GDP growth, CPI inflation, and the average percentage change in gross tax revenues. The sample period is 1990 – 2017.
We assess the accuracy from multiple aspects: over time, relative to other forecasters, and across different forecast horizons.
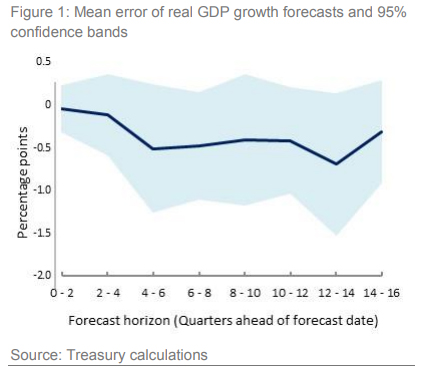
In terms of unbiasedness, there is not enough evidence to conclude that the Treasury has consistently over- or under-predicted the variables evaluated in this Special Topic. This result holds across forecast horizons ranging from 1 quarter before the actual outturn, to up to 20 quarters. For example, Figure 1 shows the 95% confidence interval around forecast errors for real GDP growth, i.e. we are 95% certain that the true forecast error at each forecast horizon lies within the blue band. Since the confidence interval includes zero at each forecast horizon, we cannot be certain that the true error is non-zero, so we cannot conclude that the forecast errors are biased.
In terms of forecast performance over time, we find that the Treasury’s forecasts compare favourably to other forecasts available at the time the Treasury’s forecasts were finalised in most years between 2000 and 2017 (Figure 2). Moreover, since 2013, there has been a steady and marginal improvement in forecast accuracy in GDP growth and inflation. These results might be due to several factors: the absence of large surprises in recent years, the informational advantage Treasury holds over other forecasters, as well as improved forecasting experience over time.
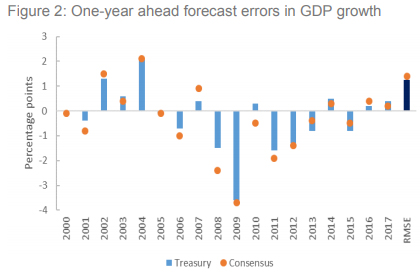
Comparisons of forecasts from different organisations are complicated as organisations do not all finalise their forecasts at the same time. As a result different information sets will have been used in compiling the predictions in any collection of forecasts at a point in time. In the comparison that follows, forecasts from other organisations are those that were available at the point in time the Treasury’s forecasts were finalised. This means that the Treasury forecasts have the most timely data (as new data will have become available after the other forecasts were finalised). Given this advantage, the result that the Treasury’s forecasts are among the most accurate is reassuring
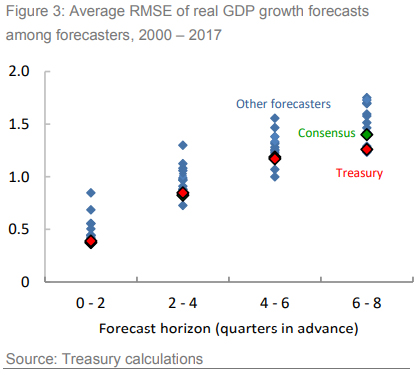
In terms of cross-sectional performance relative to other forecasters, there is evidence that the Treasury outperforms the consensus of other forecasters in real GDP growth and inflation, across both short and long forecast horizons. Figure 3 shows the comparison with respect to real GDP growth. As one can see, the relative accuracy of the Treasury is especially significant in the long-term forecast horizon.
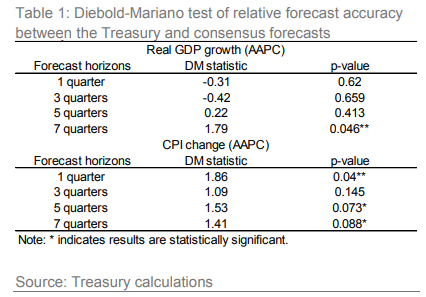
To test whether these results are statistically significant, rather than due to chance, we use DieboldMariano (DM) test to assess the relative forecast accuracy in real GDP growth and CPI inflation between the Treasury and fifteen other forecasters for the period 2000 – 2017 (Table 1). In general, the results show that the Treasury’s performance in forecasting GDP in the long-term (i.e. 7 quarters ahead) is more accurate than other forecasters. In addition, Treasury’s forecasts of inflation over the 1-quarter, 5-quarters, and 7-quarters ahead horizons are also more accurate.
This is a Special Topic in the December issue of Treasury's Monthly Economic Indicator report. Content sourced from the Treasury website.
We welcome your comments below. If you are not already registered, please register to comment.
Remember we welcome robust, respectful and insightful debate. We don't welcome abusive or defamatory comments and will de-register those repeatedly making such comments. Our current comment policy is here.