BNZ Interest Rate Strategy: Attractive or Not?
By Kymberly Martin
- An improving tone in US economic data, suggests US long yields to rise
- NZ 10-year government bond yields should also rise from depressed levels
- We expect NZ 10-year yields to rise to 5.5% by mid 2012 and NZ-US spreads to widen to almost 2.90%
- Risks to our forecasts are double-sided…
- Lower NZ 10-year yields could result as global investors continue to scour the globe for relatively “safe” yield
- Higher yields could result from global asset class shifts, as bond yields continue to look depressed relative to equity yields
A number of factors have pushed US 10-year government bond yields lower since the start of the year. Risk aversion surrounding the European debt crisis; disappointing US growth data that threatened to spell renewed recession; and the Fed’s ‘operation twist’, implemented to specifically lower long yields relative to the short-end yields.
US yields are too low…
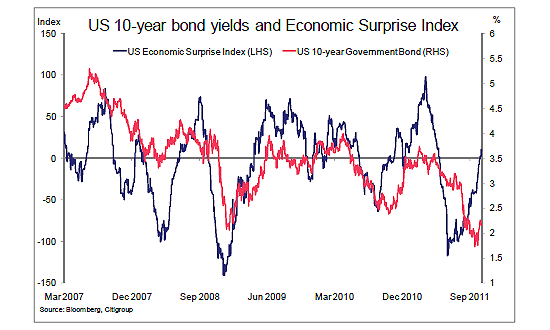
A number of factors have pushed US 10-year government bond yields lower since the start of the year. Risk aversion surrounding the European debt crisis; disappointing US growth data that threatened to spell renewed recession; and the Fed’s ‘operation twist’, implemented to specifically lower long yields relative to the short-end yields.
However, in our view, things have now gone too far. The US economic surprise index (above), this week moved into positive territory for the first time since April. i.e. On aggregate, US economic data is now surprising to the upside relative to expectations. Historically, the index leads movements in US 10-year yields. The relationship suggests significant further upside to US long yields.Daily and weekly volatility will remain high, but a general uptrend should ensue, in our view.
…NZ yields to follow
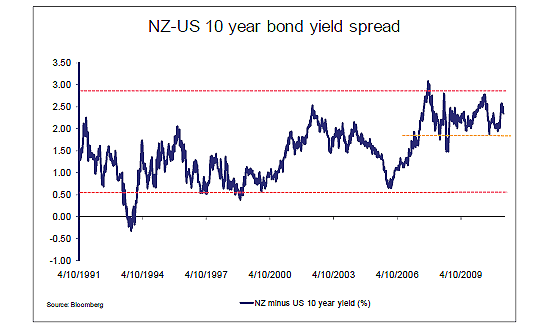
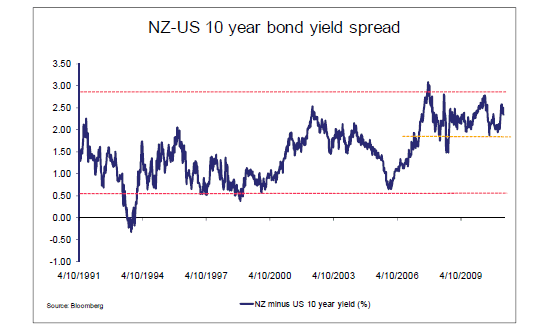
Currently, NZ 10-year yields are trading around 2.45% above their US counterparts. This is close to the middle of recent ranges. There is certainly headroom for US yields to move higher without significantly impacting NZ equivalents. However, the weekly correlation between US and NZ 10-yields remains at close to 60%, suggesting rises in US yields are likely to have a meaningful impact on NZ equivalents.
We see US 10-year moving back toward 2.50% by year end and 2.75% by end H1 2012. Our forecasts are for the NZ 10-year to be at 4.80% by year end and above 5.50% by end H1 2012. This would see the NZ-US spread widening, but remaining within recent ranges, and below 2.9%. The expected widening reflects the NZ growth outlook and OCR picking up more rapidly than in the US. It also reflects the Fed’s stated policy to keep monetary policy accommodative until well into 2013.
Risks are double-sided
The risks around our view of gradual rises to NZ 10-year yields are double-sided. (1) downside risk - NZ government yields remain attractive relative to other government yields (2) upside risk - NZ government yields remain unattractive relative to equity yields.
(1) NZ yields attractive on a global basis
The relative risk-return of holding NZ government bonds on a global basis must be considered. This is particularly important as global investors continue to hold more than 60% of NZ government bonds. They will be in a position to impartially compare yields to other global alternatives.
The table below shows the highest yielding government bonds within the developed markets universe. New Zealand features in these top ranks beside Australia. The other entries to this club however, suggest membership may be a dubious honour.
The table highlights, with sharp relief, that government bond yields are a complicated representation of a number, of sometimes opposing, factors. A high yield can be a sign of strength or a sign of weakness.
On one hand, a government bond yield theoretically represents nominal growth over the duration of the bond. A higher yield can thus represent strength in an economy.
On the other hand, a government bond yield incorporates a premium to cover perceived risks. Central to these is sovereign default risk. Others include currency, inflation and liquidity risk. In this regard, a higher yield represents vulnerability.
More attractive than high yielding Europeans?
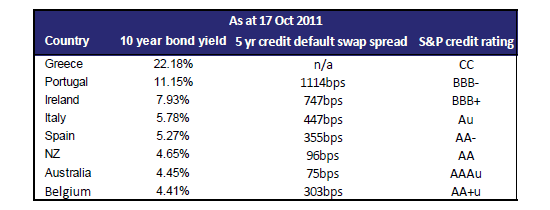
Therefore, the European members of this table are largely present due to the latter criteria i.e due to recent rises in their yields that reflect additional risk premium being assigned to these European sovereigns. In effect, these sovereigns now trade as credits, relative to “safe haven” German bonds.
The second column, in the table illustrates this clearly. 5-year Credit Default Swap spreads assign a significantly higher probability of default for the European sovereigns than for NZ and Australia. This is the case even after
rating agency S&P’s recent downgrade to the NZ sovereign rating, to AA from AA+. NZ’s CDS spread currently trades at a relatively modest 100bps. Spain, whose credit rating is not significantly different to NZ’s, has a CDS spread of 355bps.
Markets are therefore adding default risk premium to European government bond yields irrespective of actual credit ratings. Therefore, the European representatives of the table are currently at, or well above, their respective pre-2009 average yields. NZ 10-year yields (4.7%), by contrast, are currently well below, pre-2009 averages (6.7%).
Why, then, are NZ and Australia on this table at all, given, that sovereign risk appears not to be a key factor? As alluded to earlier, is it due to their economic strength? Is the market pricing strong nominal growth from NZ and Australia over the medium-term?
There is more to it than that. Historically, over the past two decades, NZ yields have tended to be high relative to OECD peers.
The reason for this, have been discussed, in detail, in numerous forums. One conclusion is that the relatively high level of NZ rates does not relate to an endogenous country risk premium being added to NZ. Rather, it is due to NZ’s domestic savings and investment imbalances. i.e NZ’s low savings rate relative to investment, means higher real interest rates are required to maintain inflation within the central banks target range. Turning cause and effect on its head, it therefore argues that foreign savings seek out NZ’s higher yield, as opposed demanding it to offset perceived NZ specific risks.
High NZ yields relative to peers have therefore persisted for an extended period. A full convergence of NZ interest rates to the ‘world’ level is therefore unlikely as long as domestic internal imbalances persist. However, in the near-term, scope for reducing the gap exists. i.e. for NZ yields to stay lower than we forecast, even if ‘world’ yields move up. This is due to the alternative yields currently on offer. As already discussed, similar yielding European sovereigns potentially offer unpalatable default risk. By contrast, “safe haven” US and German bonds offer abysmal yields.
More attractive than low yielding “safe havens”?

“Safe haven” US (2.16%) and German (2.10%) 10-year bonds are well below their respective, pre-2009 averages (5.4% and 5.17%). This reflects; demand for “risk free” assets in current risky times; easy monetary policy, that has created excess liquidity looking for a home; overt Fed operations to lower US long yields relative to short yields; and the market revising down medium-term growth expectations for these regions.
Even so, as argued at the outset, we believe US 10-year yields are now too low. They now, more than discount a probable lower nominal growth outlook for the US, over the medium-term.
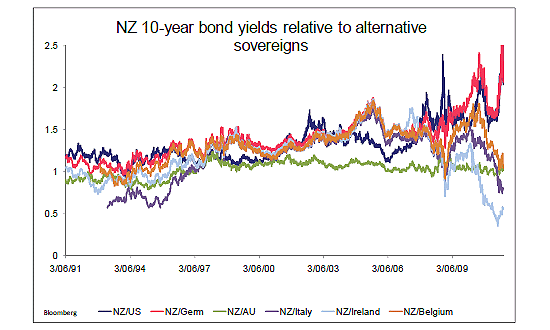
On an historic basis, therefore, NZ 10-year bond yields are in the striking position shown above. Relative to most of their European counterparts they are very depressed. Relative to “safe haven” yields they are fairly elevated. It is only relative to Australian 10-year yields that they appear close to the long-run average of 0.90%.
A global investor is therefore faced with some hard choices. Buying US and German yields, while “safe” offer a meagre yield not far above 2%. Yields have moved off their recent nadir, around 1.7%, but are still pitiful. In a desperate search for yield, therefore, an investor scans the ranks of developed nation debt (before heading off-piste into developing market bonds). In this regard, a NZ yield of 4.6% stacks up well on a risk-adjusted basis relative to Europeans.
This is the key downside risk to our NZ 10-year yield view. The continued global search for yield, particularly by investors who have fixed liabilities, could see NZ yields reduce their gap to US yields. The gap could close even in an environment where both are trending higher.
(2) Not so attractive relative to equities?
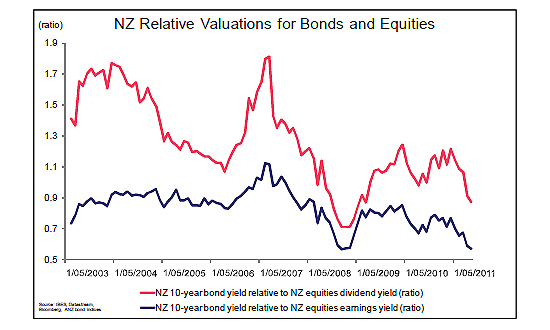
The opposite risk is represented by current NZ bond yields relative to equity yields. Whilst investors have the ability to compare government yields across countries, yields can also be compared across asset classes.
In this regard, we continue to emphasise that NZ government bond yields (and indeed credit yields) remain depressed relative to equity yields. This is true, even after equities have bounced off lows in recent weeks.
The NZ 10-year government bond yield at 4.7%, compares to a NZ 12mth forward earnings yield (inverse of P/E) at 7.7% (as at Sept). This ratio is at its lowest level since 2008. The NZ forward dividend yield at around 5.0% also remains attractive relative to bond yields. This argument is even starker in the case of the US and Germany, where their forward equity dividend yields sit at 2.3% and 4.6% respectively (as at 18 Oct), compared to their depressed bond yields (2.16%, 2.10% respectively).
Certainly equity yields are exposed to their own downside risks. Most notable is the potential for downward revisions to earning growth forecasts. For the NZ index these currently stand at 17%y/y for the coming 12 months.
However, the relative asset argument remains a real upside risk to our forecast for NZ 10-year bond yields. If risk aversion begins to subside, investors may revisit the relative value between low yielding government bonds and relatively higher yielding equities.
Forecasts

See our interactive bond rate charts here.
Kymberly Martin is part of the BNZ research team.
We welcome your comments below. If you are not already registered, please register to comment
Remember we welcome robust, respectful and insightful debate. We don't welcome abusive or defamatory comments and will de-register those repeatedly making such comments. Our current comment policy is here.