

Most of the 2018 story about investor risk and exposure has been about equities. Some big losses have been posted this year in most markets (but interestingly, not including New Zealand).
This story however reviews what has happened to benchmark bond yields in 2018.
The core reference point is the UST 10 year issue.
And this is more interesting in 2018 because it is at the heart of a juiced up American economy, one juiced by very fast rising debt to pay for its recent growth. The US annual Federal Budget deficit is now way north of US$800 bln, and its expected to burst through US$1 tln in 2019.
The credibility of the US financial system is built on the 'risk-free' status of the US Treasury issues, so how markets respond to the ballooning debt should be visible in the yields investors demand of this benchmark.
At the start of 2018, the UST 10yr yield was at 2.43% having got there with little net change in the prior twelve months. Today however, we end 2018 with that same yield at 2.73%. Investors have priced in +30 bps for the rising risk.
A rise in the yield reflects a fall in the market price of the bond itself - that is, investors have taken a capital loss. (Offsetting this somewhat will be the coupon interest payments of course.)
At the end of the September quarter, just before stocks started taking their big current dive, that UST 10yr yield was at 3.06%. The fear of the equity risk is outweighing the fear of the bond risk. Investors had demanded +63 bps for the pure deficit risk prior to the market meltdown. They are prepared to give some of that up for immediate 'safety'.
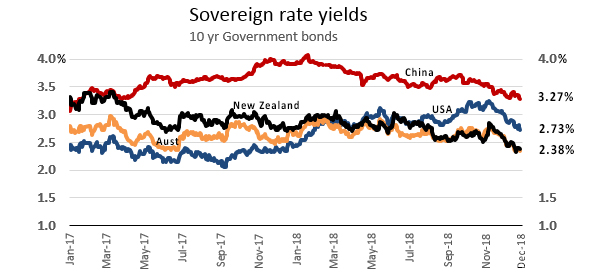
China's equity market woes have lasted far longer than the American ones - all year in fact. And their bond yield declines reflect that. After starting the year at 3.92%, they have ended at 3.27% and a full -65 bps fall in yield. In this case investors have booked a capital gain on their holdings. Plus they got the coupon interest payments. Holders of Chinese Government bonds have done very well in 2018.
The same is true for holders of New Zealand Government bonds. The NZGB 10yr started out with a yield of 2.75% and ended with a yield of 2.38%, a -37 bps drop, and that mean't the bond price rose over the period giving investors capital gains.
For holders of Australian Government 10 year bonds, the 2018 yield drop was -30 bps.
Yield curves
Bond investor signals about how they see the immediate economic prospects are often revealed in yield curves, usually the 2-10 curve.
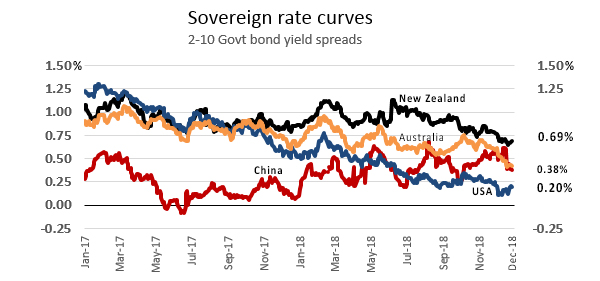
Here we see an unmistakable pattern of declining yield curves across all the economies we monitor. The current very long expansion in the business cycle has investors concerned and the premium for short-term debt issues is rising faster than the premium for longer term debt. Only China seem immune, although the very sharp fall in December along with the other 2018 gyrations and instability are cause for concern.
It is worth pointing out that the 2018 fall in the New Zealand curve (-17 bps) is far less than that for the USA (-32 bps), and even a bit less than that for Australia (-19 bps).
9 Comments
Somewhere around May 2018, something went horribly wrong. It's there on the top graph - when the US 10 year Treasury price fell below that of the NZ Bond. That's neither normal or comforting.
We can all have a stab at why it happened, and I'm sure it will be obvious in hindsight.
But for the time being, get ready for ALL interest rates to fall. Why will be economy specific, and in our case, it will be to protect the banks' asset books.
And for Donald's crowd, it might just be.....well, the same thing....
The Boom Died Months Ago, and Had Nothing To Do With Rate Hikes
https://www.realclearmarkets.com/articles/2018/12/28/the_boom_died_mont…
A partial explanation is reported here: -
"The TIC figures for June 2018, released last month, were eye opening. It wasn’t surprising that the data picked up on something. After all, May 29 wasn’t the usual trading session in global bond markets. By bond prices alone we knew it was a collateral call. We just couldn’t tell how much of one."
read article - https://www.alhambrapartners.com/2018/09/18/tic-for-july-2018-june-was-…
Yields Falling, Who Could Be Buying Without QE’s?
https://www.alhambrapartners.com/2018/12/28/yields-falling-who-could-be…
Three-month LIBOR was fixed yesterday at a fraction higher than 2.80%, meaning that if it stays around or above that level someone is losing money on it. The futures price isn’t directly translatable but back-of-the-envelope it works out to an expectation for 3-month LIBOR on that date in March to be less than what it is fixed now.
In other words, the market is seriously betting LIBOR is coming down not two years from now but in the short run. That expectation only grows the further out in time (down the curve).
https://www.alhambrapartners.com/2018/12/28/chart-of-the-week-the-dread…
The sigh of relief is palpable all across the world. The BIS called the steep, worrisome liquidations up to now Yet More Bumps On The Path To Normal, and the rallies especially in stocks and oil have served to confirm the thesis. Just some minor, dare I say transitory discomfort on the road to paradise.
Is it though?
https://www.alhambrapartners.com/2018/12/28/uh-oh-in-a-month-of-big-war…
So. 29th May to be precise! Thx....
Just when both the kids are overseas...
Part of the $1.3 trillion in “leveraged loans” — loans issued by junk-rated overleveraged companies — end up in loan mutual funds and loan ETFs. These funds saw another record outflow in the week ended December 26: $3.53 billion, according to Lipper. It was the sixth outflow in a row, another record. Over the past nine weeks, $14.8 billion had been yanked out, another record. These outflows are, as LCD, a unit of S&P Global Market Intelligence, put it, “punctuating a staggering turnaround for the asset class” that until October was red-hot:
https://wolfstreet.com/2018/12/28/loan-mutual-funds-have-record-bad-yea…
Save all that debt. Nah...burn it all down.
Gold, I guess you can make it into bullets cos you cant eat it.
We welcome your comments below. If you are not already registered, please register to comment
Remember we welcome robust, respectful and insightful debate. We don't welcome abusive or defamatory comments and will de-register those repeatedly making such comments. Our current comment policy is here.