By Stuart Bilbrough*

This is the third of six articles that look at how to transform a company’s Finance function into an effective business partner and provider of value through training.
They drill down on an article called "Closing the Skills Gap" that was published on interest.co.nz on the 8th October last year.
This training is focused on the foundation skills that all team members of a Finance function, and not just the CFO and other senior Finance roles, require before they can effectively add value as trusted advisors.
The six articles discuss six interconnected skills.
These skills are explored in more detail including relevant examples, handy frameworks and exercises that can be adapted to your business in the book, Bean Soup – Beyond Bean Counting – Steps for Lifting a Finance Function Skill Set Towards ‘Adding Value’.
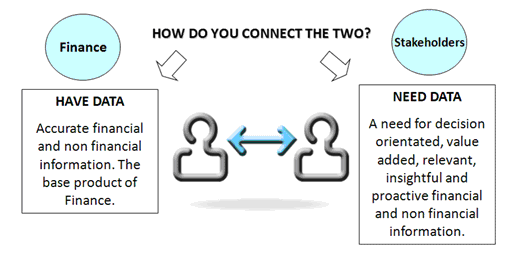
The first article addressed the need for data supplied by Finance functions to be accurate and complete.
The second article looked to assist in identifying the important decision makers within an organisation who need that data.
How are the two best connected?
They are connected through insightful, relevant and professionally prepared financial and non-financial analytics.

This part of the programme provides members of a Finance team with the right tools to assist them in preparing professional and insightful analysis which is fundamental to adding value.
Rightly or wrongly, analysis is often judged on the professionalism of its appearance.
The objective
The objective of this session is simple. It is a Finance team’s role to “provide proactive and decision-orientated financial and non-financial information and advice in a clear, concise and timely manner.”
This session shows how.
Are you hearing comments like the following?
“I generally need to interpret the numbers myself ... and I’m not an accountant!”
“There is certainly a lot of data but no information. Can’t we be provided some sort of highlights and summaries using graphs and charts?”
“I have asked Accounts to provide me with certain financial information and in a format that is easier to understand but what I receive is not what I need. I have given up.”
Would you prefer to be hearing?
“The most important source of information and guidance I get. It is always clear, informative and timely.”
“The visual effects in the form of graphs and tables help me quickly understand what is happening.”
“Finance takes the time and effort to understand our business and needs. This means the analysis provided is what we want!”
Key skills of effective financial and non-financial analysis
Different industries and/or professions find analysis in different formats more meaningful.
Finding out what works best for an organisation and its key decision makers can be initially be an exercise of trial and error.
The following is the session content and what a Finance team member needs to understand and consider every time they provide financial performance information to a Board member or business case analysis to a senior manager.
1. Source Documentation
It is important to know the sources of both financial and non-financial information, where they are located and how they can be used to best effect. Where it comes from may be internal or external to the organisation. Too often Finance consider that the primary and only source of data comes from the general ledger.
2. Types of Visual Analysis
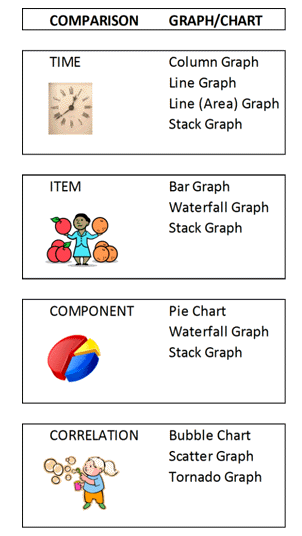
It is important to understand the types of visual analysis that can best interpret data. By not selecting the correct visual media there is a risk of distorting the message Finance is trying to provide. This includes selecting the right tables, graphs and charts to demonstrate a particular comparison. The following assists with selecting the right visual media.

3. The Guiding Principles of Insightful Financial and Non-financial Analytics
The next step is the principles that should be used to engage a stakeholder and provide them with exactly what they want and need. The following steps should be considered every time there is a need for a new piece of analysis.

4. Format Basics
Analytics is the primary “product” of Finance and therefore must be a reflection of Finance’s professionalism. As an absolute minimum the format of presentation should be consistent (for example font size and themes), simple and reflect the flavour of the business Finance partners. For example at Radius Care Limited branding is blue therefore analysis provided by Finance has shading in blue and were applicable the inclusion of the company logo.
Ask these questions about your team's understanding of financial and non-financial analysis
Have a look at ALL of the reports that are prepared for the key decision- makers of the organisation on the regular basis. For a smaller to medium-sized organisation this will include the Board, the CEO and heads of departments (as applicable).
1. Does the analysis look professionally prepared in a format that is consistent and simple?
2. Is the analysis decision-orientated with insightful commentary that is authoritative (that is, they know what they’re talking about!)?
3. Are the stakeholders who are receiving the analysis satisfied with what they get?
|
What is “Decision Orientated” - This is information that is useful and assists the receiver in understanding and growing their business unit or department. They gain knowledge that they can use and do not need to interpret themselves. |
Wrap up
So why should the Finance functions that support New Zealand’s corporates, Government and Not for Profit be concerned about the professionalism of what they prepare and present?
I refer to this as the “In-house Big 4 Consultancy” question. It essentially asks the question, “Should organisations expect the same level of professionalism, care and value in presentation of reports that they receive when engaging an external consultancy?”
There is only one answer and that is “Of course they should!”
Here is why:
a. The professionalism of visual analysis is often judged by its appearance.
b. Finance’s stakeholders are more likely to view analysis as reliable if its presentation is impeccable.
c. Poor presentation will distract from the message to be conveyed.
d. High-quality presentations will be more effective in engaging the stakeholder.
e. There is nothing more likely to repel senior managers and Board of Directors than pages and pages of seemingly impenetrable data! That is, “Data rich, knowledge poor.”
Next month
The next article looks at financial planning and the Strategic Plan. It discusses the need to tie the strategies of an organisation to its financial realities using financial planning tools and how critical Finance is in taking a lead in this.
Adding value using historical data tends to provide reactive solutions. Adding value during a financial planning process provides proactive opportunities. The value that Finance can provide during financial planning will have tangible and positive outcomes for the future. This is the best value.
--------------------------------------------------------------------------------------------------------
Stuart Bilbrough is the author of the book, Bean Soup – Beyond Bean Counting. You can read a review of the book here. You can buy it here.
We welcome your comments below. If you are not already registered, please register to comment
Remember we welcome robust, respectful and insightful debate. We don't welcome abusive or defamatory comments and will de-register those repeatedly making such comments. Our current comment policy is here.